Plotlyはプロットしたデータを動かすことができるのが大きな魅力の1つだが、本記事では使えると非常に強力で便利なボタン機能(updatemenus)を解説する。
ボタン機能があると2種類のデータを1つのグラフに入れて切り替えて表示することができる。今まで2ファイルで保存していたのが1ファイルで済むようになったということだ。
さらにPlotlyではhtmlで保存もできるから、必要な機能をボタンで作成してhtmlで保存しておけば、後から見てもすぐに必要なグラフが手に入る。
本記事ではそんな便利なボタン機能(updatemenus)を日本語でわかりやすく解説する。
Python環境は以下。
- Python 3.10.8
- numpy 1.24.0
- plotly 5.11.0
- plotly-orca 3.4.2
参考になるサイト
Plotly公式
Qiita
本記事のコード全文
下準備のimport
import numpy as np
import plotly.express as px
import plotly.graph_objects as go
import plotly.io as pio
import webcolors
まずは下準備としてのimport関連。今回は基本goを使用するが、一部データを作成・読み込みするためにnumpyを使用するのでimport。
pxは今回は触れないが、色関係で必要なのでimport。webcolorsは指定した’red’などの色をRGB形式に変換してくれるライブラリ。詳しくは公式ドキュメントを参照。
pioはplotlyでのグラフ保存用のライブラリ。保存の仕方は色々あるがpioはその1つだ。
ボタンなしのgo.Scatterグラフ
まずはボタン機能なしの通常のgo.Scatterのグラフから。ここでは2種類のデータy1, y2を1つのグラフにした。詳しいgo.Scatterのグラフについては下記参照。
-
-
【Plotlyで散布図】go.Scatterのグラフの描き方まとめ
これからPloltyで動くグラフを作りたい、もっとグラフをキ ...
続きを見る
このグラフをベースに、本記事でPlotly特有のボタン機能を追加する。
import plotly.graph_objects as go
import plotly.io as pio

# 2つのグラフをシンプルにグラフ化

x = (0, 1, 2, 3, 4)
y1 = (0, 1, 4, 3, 2)
y2 = (1, 3, 2, 4, 0)

# 配列の要素にプロット内容を格納
plot = [
    go.Scatter(x=x, y=y1, name='y1'),
    go.Scatter(x=x, y=y2, name='y2'),
]

# レイアウトの作成
layout = go.Layout(
    title='title',  # グラフタイトル
    font_size=20,  # グラフ全体のフォントサイズ
    hoverlabel_font_size=20  # ホバーのフォントサイズ
)

# グラフの表示
fig = go.Figure(data=plot, layout=layout)
fig.show()

# グラフの保存
prefix = 'plotly-buttons'
save_name = f"{prefix}_simple_plot"
pio.orca.config.executable = '/Applications/orca.app/Contents/MacOS/orca'
pio.write_html(fig, f"{save_name}.html")
pio.write_image(fig, f"{save_name}.png")
updatemenusでボタンを設置
本記事の本題となるボタン機能をグラフの上部に追加した。ボタンのラベルはそれぞれy1, y2でプロットしたデータと同じしている。
これらのボタンを押すと、そのラベルに対応したグラフが非表示・表示される。
ボタンの追加はややこしいので、以下のステップに分解し解説する。上のグラフを作成するための全コードはこの章の最後に記載した。
プロットするデータの用意
x = (0, 1, 2, 3, 4)
y1 = (0, 1, 4, 3, 2)
y2 = (1, 3, 2, 4, 0)

# 配列の要素にプロット内容を格納
plot = [
    go.Scatter(x=x, y=y1, name='y1'),
    go.Scatter(x=x, y=y2, name='y2'),
]
まずはいつも通りプロットするデータを用意する。ここでは
y1,y2の合計2データを用意し、それぞれgo.Scatterにして変数plotに格納した。引数nameはつけなくてもいいが、ボタンラベルとの整合性とわかりやすさのためにそれぞれの
y1,y2とした。ボタンを押した時の処理を作成
# y1表示用のボタン作成 button1 = dict( label='y1', # ボタンのラベル method='update', # ボタンの適用範囲はデータプロットとレイアウト args=[ dict(visible=[True, False]), # y1のみ表示 dict(title='y1 plot'), # グラフタイトル ] ) # y2表示用のボタン作成 button2 = dict( label='y2', # ボタンのラベル method='update', # ボタンの適用範囲はデータプロットとレイアウト args=[ dict(visible=[False, True]), # y2のみ表示 dict(title='y2 plot'), # グラフタイトル ] )続いてはボタンの設定だが、まずはボタンが押された時のそれぞれのボタンの処理内容を作成。それぞれの変数は以下の意味を持つ。詳しくは公式ドキュメント参照。
label:ボタンにつけるラベルmethod:ボタンの影響範囲restyle:データまたはデータ属性の変更relayout:レイアウト属性の変更update:restyleとrelayoutの両方の変更が可能animate:アニメーションの作成
args:ボタンを押した時の動作内容(下記はmethod=updateの時)- 1つ目の
dict:データ関連の処理 - 2つ目の
dict:レイアウト関連の処理
- 1つ目の
これらの他にも多数の引数があるが、ここでは基礎的な内容として最小限に留めておく。詳しくは公式ドキュメント参照。
今回のボタンでは
method=updateに設定し、argsの1つ目のdictでvisibleを設定した。visibleは「1回」ボタンを押した時に以下の動作をするという意味だ。visible=[True, False]:1つ目のプロットだけ表示visible=[False, True]:2つ目のプロットだけ表示
なお、今回のボタン設定だけでは同じボタンを2回押しても何も起きない。同じボタンを2回押した時の動作については以下の記事で解説したような別の処理が必要。
-
-
【Plotly&ボタン】updatemenusのargs2で2回目のボタン押下機能を追加
今回はPlotlyのボタン機能に2回目のボタン押下の処理を追加& ...
続きを見る
argsの2つ目のdictではレイアウト関連の設定ができるが、ここではわかりやすいようにグラフタイトルを設定しておいた。ボタン処理をlistに格納
# ボタンをひとまとめにする
buttons = [button1, button2]
作成したボタン処理は1つの配列に格納する必要がある。ここでは
list形式にしたがもちろんtupleでも問題ない。plotlyでは複数の処理を作成したらこのように配列に入れることが多いのでこの機会に慣れておこう。ボタンのレイアウトを設定
# レイアウトに設置するためのupdatemenus作成 updatemenus = [ dict( active=0, # 初期グラフで見た目上、押されるボタン type='buttons', # ボタンのタイプはボタンに direction='right', # ボタンは右向きに配置 x=0.5, y=1.01, # ボタンの位置 xanchor='center', yanchor='bottom', # ボタンの位置の基準 buttons=buttons, # ここに設定したボタン情報を入れる ) ]先ほどはボタン処理を設定したが、ここではボタン自体のレイアウトを設定する。今回設定した内容は以下。もちろんこれら以外にも設定内容があるので、詳しくは公式ドキュメントを参照いただきたい。
active:グラフ表示時に見た目上押されているボタンtype:ボタンの種類direction:ボタンの配置方向x:ボタンのx位置y:ボタンのy位置xanchor:ボタンのx位置の基準yanchor:ボタンのy位置の基準buttons:ボタンの処理の内容
引数
activeはわかりづらいが、グラフが表示された際、1つ前のステップで作成した変数buttonsの何番目のボタンを押しているようにするかの設定だ。acrive=0の場合だと変数buttonsの0番目、すなわちbutton1(プロットで言えばy1)が押された状態となる。なお、押されていない状態にしたかったら-1を指定する。Parent:
layout.updatemenus[]Type: integer greater than or equal to -1
Default:
0Determines which button (by index starting from 0) is considered active.
Python Figure Reference: layout.updatemenus -active
引数
typeについては後述する。引数buttonsは作成したボタン設定を入れ、今回だと同じ名称の変数buttonsを作成したのでこれを使う。updatemenusをレイアウトに設定
# レイアウトの作成
layout = go.Layout(
    font_size=20,  # グラフ全体のフォントサイズ
    hoverlabel_font_size=20,  # ホバーのフォントサイズ
    updatemenus=updatemenus,  # ボタンを設置
)
作成した
updatemeusはレイアウト関連なので、go.Figureの引数layoutに直接記述するか今回のようにgo.Layoutを使ってグラフレイアウトで設定する。グラフの表示と保存
# グラフの表示
fig = go.Figure(data=plot, layout=layout)
fig.show()

# グラフの保存
prefix = 'plotly-buttons'
save_name = f"{prefix}_2buttons"
pio.orca.config.executable = '/Applications/orca.app/Contents/MacOS/orca'
pio.write_html(fig, f"{save_name}.html")
pio.write_image(fig, f"{save_name}.png")
あとは作成したデータとレイアウトを
go.Figureに入れてグラフを表示・保存するだけ。ここら辺は他のグラフ表示・保存と同じ。
import plotly.graph_objects as go
import plotly.io as pio

# 2つのグラフを切り替えられるボタンを作成

x = (0, 1, 2, 3, 4)
y1 = (0, 1, 4, 3, 2)
y2 = (1, 3, 2, 4, 0)

# 配列の要素にプロット内容を格納
plot = [
    go.Scatter(x=x, y=y1, name='y1'),
    go.Scatter(x=x, y=y2, name='y2'),
]

# y1表示用のボタン作成
button1 = dict(
    label='y1',  # ボタンのラベル
    method='update',  # ボタンの適用範囲はデータプロットとレイアウト
    args=[
        dict(visible=[True, False]),  # y1のみ表示
        dict(title='y1 plot'),  # グラフタイトル
    ]
)
# y2表示用のボタン作成
button2 = dict(
    label='y2',  # ボタンのラベル
    method='update',  # ボタンの適用範囲はデータプロットとレイアウト
    args=[
        dict(visible=[False, True]),  # y2のみ表示
        dict(title='y2 plot'),  # グラフタイトル
    ]
)

# ボタンをひとまとめにする
buttons = [button1, button2]

# レイアウトに設置するためのupdatemenus作成
updatemenus = [
    dict(
        active=0,  # 初期グラフで見た目上、押されるボタン
        type='buttons',  # ボタンのタイプはボタンに
        direction='right',  # ボタンは右向きに配置
        x=0.5, y=1.01,  # ボタンの位置
        xanchor='center', yanchor='bottom',  # ボタンの位置の基準
        buttons=buttons,  # ここに設定したボタン情報を入れる
    )
]

# レイアウトの作成
layout = go.Layout(
    font_size=20,  # グラフ全体のフォントサイズ
    hoverlabel_font_size=20,  # ホバーのフォントサイズ
    updatemenus=updatemenus,  # ボタンを設置
)

# グラフの表示
fig = go.Figure(data=plot, layout=layout)
fig.show()

# グラフの保存
prefix = 'plotly-buttons'
save_name = f"{prefix}_2buttons"
pio.orca.config.executable = '/Applications/orca.app/Contents/MacOS/orca'
pio.write_html(fig, f"{save_name}.html")
pio.write_image(fig, f"{save_name}.png")
全データを表示するためのボタンを追加
無事にボタンを設定することはできたが、このままだと片方どちらかのプロットしか表示できないので使い勝手が悪い。ということで、y1, y2の両方のグラフを同時に表示するボタンも追加する。
要領はy1, y2のボタンと同じで、button1, button2のように新たにボタン処理を作成してupdatemenusに反映させるだけ。今回はbutton_allという変数を作成した。
argsのvisibleはどちらのボタンも表示したいので、visible=[True, True]でTrueを2つに設定。もちろんどちらもFalseにするとグラフが消える。
import plotly.graph_objects as go
import plotly.io as pio

# 2つのグラフを切り替え+全グラフ表示のボタン

x = (0, 1, 2, 3, 4)
y1 = (0, 1, 4, 3, 2)
y2 = (1, 3, 2, 4, 0)

# 配列の要素にプロット内容を格納
plot = [
    go.Scatter(x=x, y=y1, name='y1'),
    go.Scatter(x=x, y=y2, name='y2'),
]

# 2プロット表示用のボタン作成
button_all = dict(
    label='all',  # ボタンのラベル
    method='update',  # ボタンの適用範囲はデータプロットとレイアウト
    args=[
        dict(visible=[True, True]),  # y1, y2の両方を表示
        dict(title='all plots'),  # グラフタイトル
    ]
)
# y1表示用のボタン作成
button1 = dict(
    label='y1',  # ボタンのラベル
    method='update',  # ボタンの適用範囲はデータプロットとレイアウト
    args=[
        dict(visible=[True, False]),  # y1のみ表示
        dict(title='y1 plot'),  # グラフタイトル
    ]
)
# y2表示用のボタン作成
button2 = dict(
    label='y2',  # ボタンのラベル
    method='update',  # ボタンの適用範囲はデータプロットとレイアウト
    args=[
        dict(visible=[False, True]),  # y2のみ表示
        dict(title='y2 plot'),  # グラフタイトル
    ]
)

# ボタンをひとまとめにする
buttons = [button_all, button1, button2]

# レイアウトに設置するためのupdatemenus作成
updatemenus = [
    dict(
        active=0,  # 初期グラフで見た目上、押されるボタン
        type='buttons',  # ボタンのタイプはボタンに
        direction='right',  # ボタンは右向きに配置
        x=0.5, y=1.01,  # ボタンの位置
        xanchor='center', yanchor='bottom',  # ボタンの位置の基準
        buttons=buttons,  # ここに設定したボタン情報を入れる
    )
]

# レイアウトの作成
layout = go.Layout(
    font_size=20,  # グラフ全体のフォントサイズ
    hoverlabel_font_size=20,  # ホバーのフォントサイズ
    updatemenus=updatemenus,  # ボタンを設置
)

# グラフの表示
fig = go.Figure(data=plot, layout=layout)
fig.show()

# グラフの保存
prefix = 'plotly-buttons'
save_name = f"{prefix}_3buttons"
pio.orca.config.executable = '/Applications/orca.app/Contents/MacOS/orca'
pio.write_html(fig, f"{save_name}.html")
pio.write_image(fig, f"{save_name}.png")
ボタンを押しても色が変わらないようにする
気付いた人もいるかもしれないが、今回作成したボタンy1, y2を押すとy2のプロットの色がy1と同じ青系の色に変わってしまう。これだとわかりづらい。
ということで、初めのgo.Scatterの時点でプロットの色を指定した。Plotlyのデフォルトのプロットカラーは以下のpxから取得可能。
# Plotlyのデフォルトの色を取得
default_colors = px.colors.qualitative.Plotly
print(default_colors)
# ['#636EFA', '#EF553B', '#00CC96', '#AB63FA', '#FFA15A', '#19D3F3', '#FF6692', '#B6E880', '#FF97FF', '#FECB52']
また、1プロットだけにした際に強制的に凡例が消されるので、go.Scatterの引数showlegendで常に凡例が表示されるように設定。これでボタンを押した時の凡例の有無によるグラフサイズの変更がなくなる。
# 配列の要素にプロット内容を格納
plot = [
    go.Scatter(
        x=x, y=y1, name='y1',
        marker_color=default_colors[0],  # デフォルトカラーを指定
        showlegend=True  # 凡例は常に表示
    ),
    go.Scatter(
        x=x, y=y2, name='y2',
        marker_color=default_colors[1],  # デフォルトカラーを指定
        showlegend=True  # 凡例は常に表示
    )
]
あとは先ほどと同じようにボタン処理を設定してレイアウトにボタンを配置するだけ。
import plotly.express as px
import plotly.graph_objects as go
import plotly.io as pio

# 1プロットにしてもプロットの色を変えない

x = (0, 1, 2, 3, 4)
y1 = (0, 1, 4, 3, 2)
y2 = (1, 3, 2, 4, 0)

# Plotlyのデフォルトの色を取得
default_colors = px.colors.qualitative.Plotly
print(default_colors)
# ['#636EFA', '#EF553B', '#00CC96', '#AB63FA', '#FFA15A', '#19D3F3', '#FF6692', '#B6E880', '#FF97FF', '#FECB52']

# 配列の要素にプロット内容を格納
plot = [
    go.Scatter(
        x=x, y=y1, name='y1',
        marker_color=default_colors[0],  # デフォルトカラーを指定
        showlegend=True  # 凡例は常に表示
    ),
    go.Scatter(
        x=x, y=y2, name='y2',
        marker_color=default_colors[1],  # デフォルトカラーを指定
        showlegend=True  # 凡例は常に表示
    )
]

# 2プロット表示用のボタン作成
button_all = dict(
    label='all',  # ボタンのラベル
    method='update',  # ボタンの適用範囲はデータプロットとレイアウト
    args=[
        dict(visible=[True, True]),  # y1, y2の両方を表示
        dict(title='all plots'),  # グラフタイトル
    ]
)
# y1表示用のボタン作成
button1 = dict(
    label='y1',  # ボタンのラベル
    method='update',  # ボタンの適用範囲はデータプロットとレイアウト
    args=[
        dict(visible=[True, False]),  # y1のみ表示
        dict(title='y1 plot'),  # グラフタイトル
    ]
)
# y2表示用のボタン作成
button2 = dict(
    label='y2',  # ボタンのラベル
    method='update',  # ボタンの適用範囲はデータプロットとレイアウト
    args=[
        dict(visible=[False, True]),  # y2のみ表示
        dict(title='y2 plot'),  # グラフタイトル
    ]
)

# ボタンをひとまとめにする
buttons = [button_all, button1, button2]

# レイアウトに設置するためのupdatemenus作成
updatemenus = [
    dict(
        active=0,  # 初期グラフで見た目上、押されるボタン
        type='buttons',  # ボタンのタイプはボタンに
        direction='right',  # ボタンは右向きに配置
        x=0.5, y=1.01,  # ボタンの位置
        xanchor='center', yanchor='bottom',  # ボタンの位置の基準
        buttons=buttons,  # ここに設定したボタン情報を入れる
    )
]

# レイアウトの作成
layout = go.Layout(
    font_size=20,  # グラフ全体のフォントサイズ
    hoverlabel_font_size=20,  # ホバーのフォントサイズ
    updatemenus=updatemenus,  # ボタンを設置
)

# グラフの表示
fig = go.Figure(data=plot, layout=layout)
fig.show()

# グラフの保存
prefix = 'plotly-buttons'
save_name = f"{prefix}_3buttons_default_colors"
pio.orca.config.executable = '/Applications/orca.app/Contents/MacOS/orca'
pio.write_html(fig, f"{save_name}.html")
pio.write_image(fig, f"{save_name}.png")
ドロップダウン式のボタンを設置
ここまでのボタンは単に押すだけのボタンだった。2, 3個と言った数個のボタンならこれで問題ないが、10を超えてくるとさすがに並べるほどの余白がない。
そこで有効活用できるのがドロップダウン式のボタンだ。ドロップダウンを使うことで普段は選択ボタンだけ表示し、必要な時だけボタンを出すことができる。
設定は簡単で、updatemenusの引数typeをtype=’dropdown’と設定するだけ。
# レイアウトに設置するためのupdatemenus作成
updatemenus = [
    dict(
        active=-1,  # -1にすると初期グラフでは見た目上ボタンは押されない
        type='dropdown',  # ボタンのタイプはドロップダウン
        direction='down',  # ボタンは下向きに配置
        x=0.5, y=1.01,  # ボタンの位置
        xanchor='center', yanchor='bottom',  # ボタンの位置の基準
        buttons=buttons,  # ここに設定したボタン情報を入れる
    )
]
ちなみにtypeのデフォルトは’dropdown’なので、明示しなくて自動でドロップダウンになる。
なお、ドロップダウンにする場合は一般的な感覚として下方向に展開するので、updatemenusの引数direction=’bottom’で下方向に展開するようにした。
また、acrive=-1も試しに設定。-1にすることでグラフ作成時にドロップダウンは選択されていない表示にできる。
import plotly.graph_objects as go
import plotly.io as pio

# ドロップダウン形式のボタンも作成

x = (0, 1, 2, 3, 4)
y1 = (0, 1, 4, 3, 2)
y2 = (1, 3, 2, 4, 0)

# 配列の要素にプロット内容を格納
plot = [
    go.Scatter(x=x, y=y1, name='y1'),
    go.Scatter(x=x, y=y2, name='y2'),
]

# 2プロット表示用のボタン作成
button_all = dict(
    label='all',  # ボタンのラベル
    method='update',  # ボタンの適用範囲はデータプロットとレイアウト
    args=[
        dict(visible=[True, True]),  # y1, y2の両方を表示
        dict(title='all plots'),  # グラフタイトル
    ]
)
# y1表示用のボタン作成
button1 = dict(
    label='y1',  # ボタンのラベル
    method='update',  # ボタンの適用範囲はデータプロットとレイアウト
    args=[
        dict(visible=[True, False]),  # y1のみ表示
        dict(title='y1 plot'),  # グラフタイトル
    ]
)
# y2表示用のボタン作成
button2 = dict(
    label='y2',  # ボタンのラベル
    method='update',  # ボタンの適用範囲はデータプロットとレイアウト
    args=[
        dict(visible=[False, True]),  # y2のみ表示
        dict(title='y2 plot'),  # グラフタイトル
    ]
)

# ボタンをひとまとめにする
buttons = [button_all, button1, button2]

# レイアウトに設置するためのupdatemenus作成
updatemenus = [
    dict(
        active=-1,  # -1にすると初期グラフでは見た目上ボタンは押されない
        type='dropdown',  # ボタンのタイプはドロップダウン
        direction='down',  # ボタンは下向きに配置
        x=0.5, y=1.01,  # ボタンの位置
        xanchor='center', yanchor='bottom',  # ボタンの位置の基準
        buttons=buttons,  # ここに設定したボタン情報を入れる
    )
]

# レイアウトの作成
layout = go.Layout(
    font_size=20,  # グラフ全体のフォントサイズ
    hoverlabel_font_size=20,  # ホバーのフォントサイズ
    updatemenus=updatemenus,  # ボタンを設置
)

# グラフの表示
fig = go.Figure(data=plot, layout=layout)
fig.show()

# グラフの保存
prefix = 'plotly-buttons'
save_name = f"{prefix}_simple_buttons_dropdown"
pio.orca.config.executable = '/Applications/orca.app/Contents/MacOS/orca'
pio.write_html(fig, f"{save_name}.html")
pio.write_image(fig, f"{save_name}.png")
forループを使ってボタンを作成
ここまでボタンの処理の作成は変数button1, button2の2種類の変数を使って作成した。ここでは1つひとつ作成するのではなく、forループを使って作成する方法を解説する。
実際、使用する上ではいちいち変数を置いて書くのは面倒なのでforループを使うことが増えるだろう。forループを使う際にはちょっと頭を捻る必要があるが、慣れると問題ない。
ボタン処理の引数argsのvisibleはTrueにすると表示、Falseにすると非表示になるということはすでに説明したが、これをforで実現するには以下の方法がシンプル。
- 一旦全て
False(もしくはTrue)にする True(もしくはFalse)にしたい場所だけ変更
1.は以下の部分だ。今回は全てのプロットを一度Falseにして非表示にした。
visible = [False] * len(plot)
続いて、真偽を逆転させたい箇所だけインデックスを使って変更する。今回は何回目のループかを示す変数numをそのまま使った。
visible[num] = [True]
あとは各ループで作成したボタン処理buttonを配列buttonsに入れるだけ。今回はあらかじめ変数button_allを作成してbuttonsに入れておいた。
buttons.append(button)
updatemenusなどはすでにできたボタン処理の配列buttonsを使うだけだからforとは関係ない。もちろんforを使って書き換え(リファクタリング)しただけなのでできるグラフは同じだ。
import plotly.graph_objects as go
import plotly.io as pio

# forを使って短く描く

x = (0, 1, 2, 3, 4)
y1 = (0, 1, 4, 3, 2)
y2 = (1, 3, 2, 4, 0)

# 配列の要素にプロット内容を格納
plot = [
    go.Scatter(x=x, y=y1, name='y1'),
    go.Scatter(x=x, y=y2, name='y2'),
]

# 2プロット表示用のボタン作成
button_all = dict(
    label='all',  # ボタンのラベル
    method='update',  # ボタンの適用範囲はデータプロットとレイアウト
    args=[
        dict(visible=[True, True]),  # y1, y2の両方を表示
        dict(title='all plots'),  # グラフタイトル
    ]
)
# 2プロット表示用のボタンを先に入れる
buttons = [button_all]

# forを使ってボタン作成を短く書く
for num, data in enumerate(plot):
    # 一旦全てのプロットを非表示にしてから、該当するプロットを表示変更
    visible = [False] * len(plot)
    visible[num] = [True]

    # ボタン作成
    button = dict(
        label=data['name'],  # ボタンのラベル
        method='update',  # ボタンの適用範囲はデータプロットとレイアウト
        args=[
            dict(visible=visible),  # y1のみ表示
            dict(title=f"{data['name']} plot"),  # グラフタイトル
        ]
    )
    buttons.append(button)

# レイアウトに設置するためのupdatemenus作成
updatemenus = [
    dict(
        active=0,  # 初期グラフで見た目上、押されるボタン
        type='buttons',  # ボタンのタイプはボタンに
        direction='right',  # ボタンは右向きに配置
        x=0.5, y=1.01,  # ボタンの位置
        xanchor='center', yanchor='bottom',  # ボタンの位置の基準
        buttons=buttons,  # ここに設定したボタン情報を入れる
    )
]

# レイアウトの作成
layout = go.Layout(
    font_size=20,  # グラフ全体のフォントサイズ
    hoverlabel_font_size=20,  # ホバーのフォントサイズ
    updatemenus=updatemenus,  # ボタンを設置
)

# グラフの表示
fig = go.Figure(data=plot, layout=layout)
fig.show()

# グラフの保存
prefix = 'plotly-buttons'
save_name = f"{prefix}_simple_buttons_for"
pio.orca.config.executable = '/Applications/orca.app/Contents/MacOS/orca'
pio.write_html(fig, f"{save_name}.html")
pio.write_image(fig, f"{save_name}.png")
複数データの時にforは便利
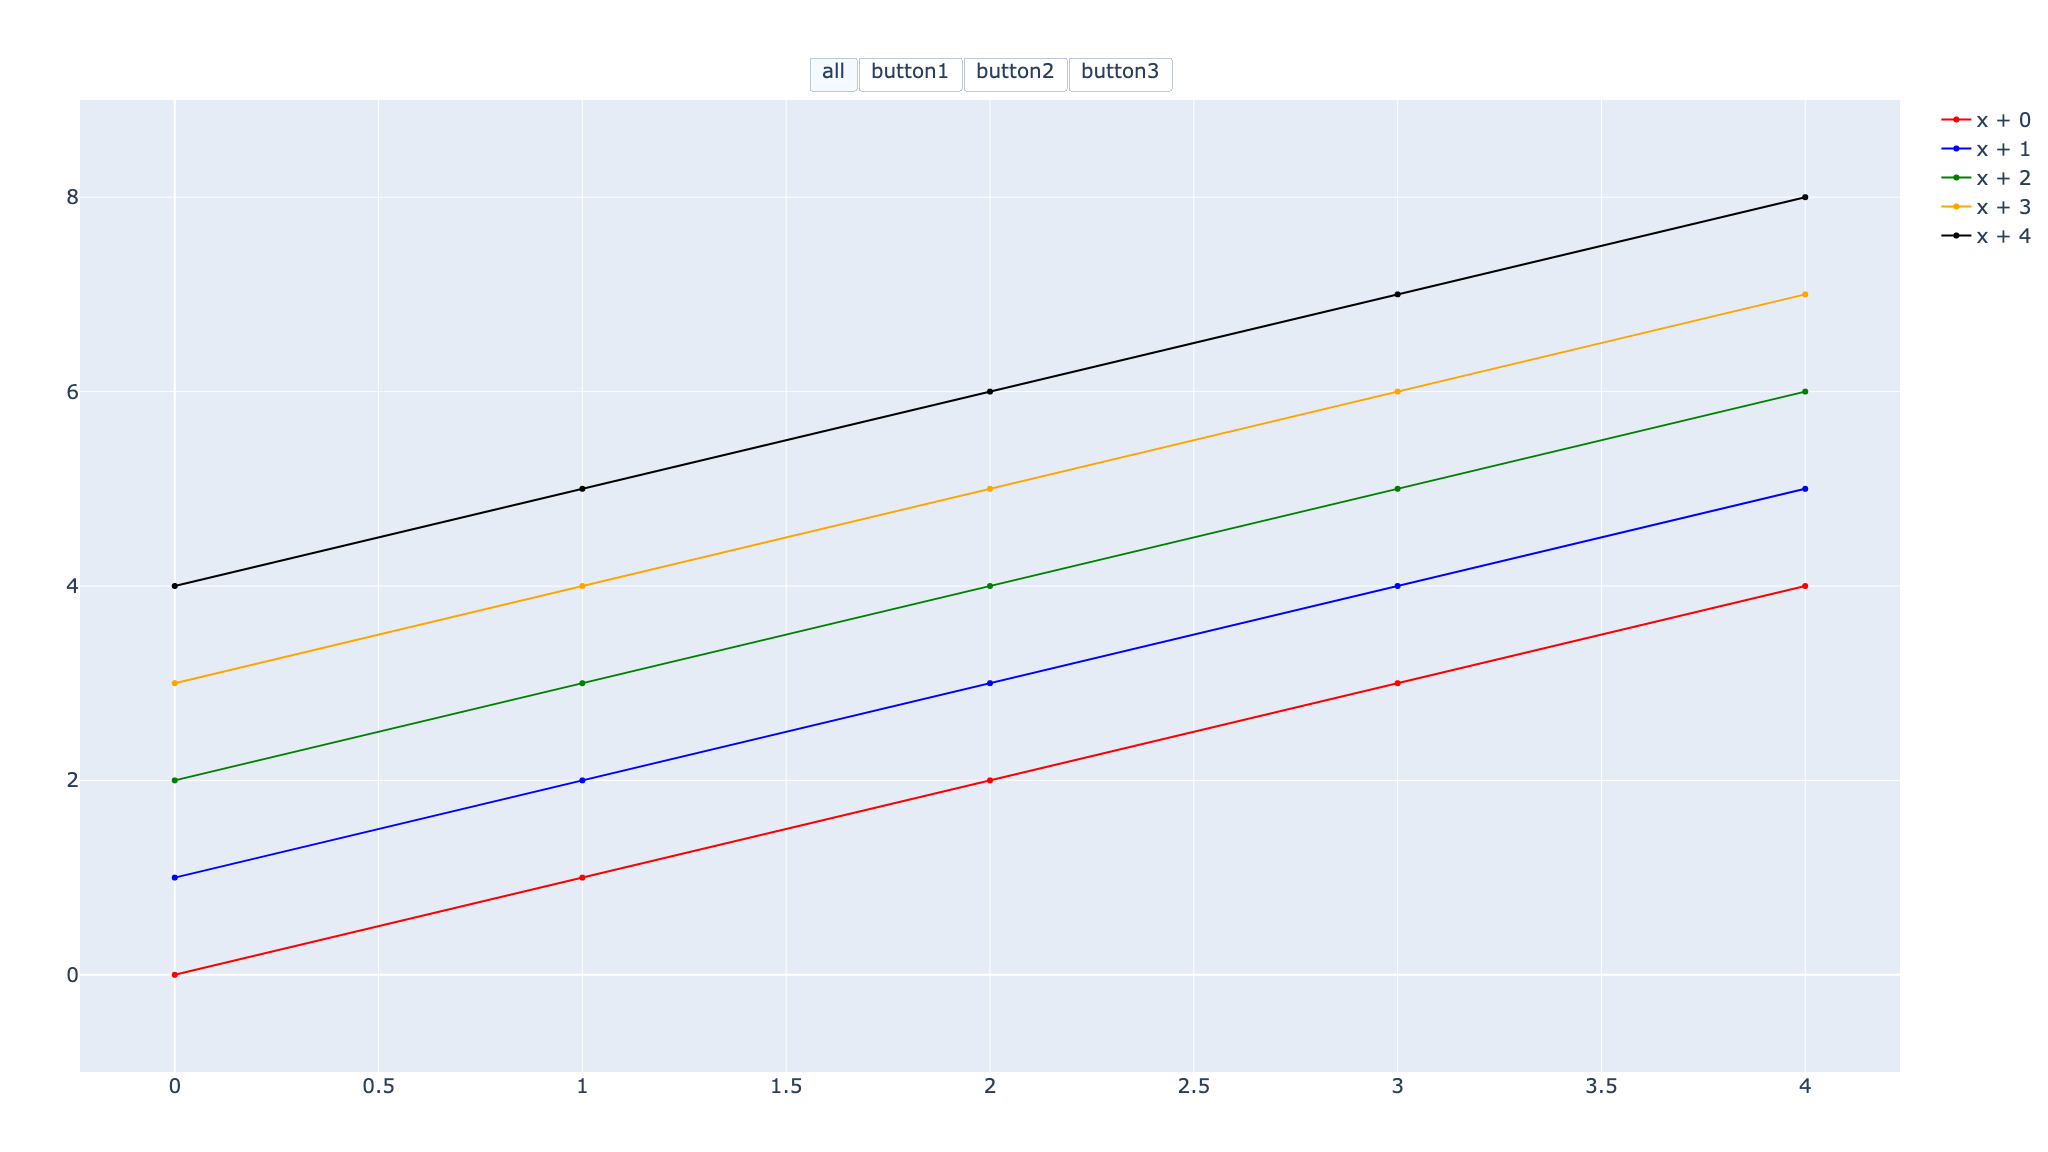
forループでグラフを作成したが、たかが2データなのでインパクトがないかもしれない。ただ、仮にここで作成した5データのグラフをbutton1, button2, …のように書くだけでも大変だろう。こういう繰り返しの処理はforを使うのが賢い。
今回のグラフはy = x + bの形式でbの値を+1ずつし、そのデータをグラフ化した。forを使うことで、各グラフのボタン処理がかなりスッキリする。
なお、レイアウトの引数yaxisの表示範囲を-1から9に固定している。
yaxis_range=(-1, 9), # 縦軸の表示範囲を固定
縦軸の表示範囲を固定していない状態でボタンでプロットを変更すると、そのとき表示されるプロットの最小値・最大値で自動で表示範囲が調節される。
今回の例だと各プロットの色が異なるから判別しやすいが、パッと見で色しか変わらない。紛らわしいのでここでは表示範囲を固定した。
import numpy as np
import plotly.graph_objects as go
import plotly.io as pio

# 切片を変更した直線のグラフを作成

x = np.arange(5)
ys = {}
for num in range(5):
    y = x + num  # y = x + bの形
    ys[f"x + {num}"] = y
print(ys)
# {'x + 0': array([0, 1, 2, 3, 4]), 'x + 1': array([1, 2, 3, 4, 5]), 'x + 2': array([2, 3, 4, 5, 6]), 'x + 3': array([3, 4, 5, 6, 7]), 'x + 4': array([4, 5, 6, 7, 8])}

# 配列の要素にプロット内容を格納
plot = []
colors = ('red', 'blue', 'green', 'orange', 'black')
for num, (name, y) in enumerate(ys.items()):
    d = go.Scatter(
        x=x, y=y, name=name,
        marker_color=colors[num],  # プロット線の色
        showlegend=True  # 凡例を常に表示
    )
    plot.append(d)

# 全プロット表示用のボタン作成
button_all = dict(
    label='all',  # ボタンのラベル
    method='update',  # ボタンの適用範囲はデータプロットとレイアウト
    args=[
        dict(visible=[True, True]),  # y1, y2の両方を表示
        dict(title='all plots'),  # グラフタイトル
    ]
)
# 全プロット表示用のボタンを先に入れる
buttons = [button_all]

# forを使ってボタン作成を短く書く
for num, data in enumerate(plot):
    # 一旦全てのプロットを非表示にしてから、該当するプロットを表示変更
    visible = [False] * len(plot)
    visible[num] = [True]

    # ボタン作成
    button = dict(
        label=data['name'],  # ボタンのラベル
        method='update',  # ボタンの適用範囲はデータプロットとレイアウト
        args=[
            dict(visible=visible),  # y1のみ表示
            dict(title=f"y = {data['name']}"),  # グラフタイトル
        ]
    )
    buttons.append(button)

# レイアウトに設置するためのupdatemenus作成
updatemenus = [
    dict(
        active=0,  # 初期グラフで見た目上、押されるボタン
        type='buttons',  # ボタンのタイプはボタンに
        direction='right',  # ボタンは右向きに配置
        x=0.5, y=1.01,  # ボタンの位置
        xanchor='center', yanchor='bottom',  # ボタンの位置の基準
        buttons=buttons,  # ここに設定したボタン情報を入れる
    )
]

# レイアウトの作成
layout = go.Layout(
    title='title',  # グラフタイトル
    font_size=20,  # グラフ全体のフォントサイズ
		yaxis_range=(-1, 9),  # 縦軸の表示範囲を固定
    hoverlabel_font_size=20,  # ホバーのフォントサイズ
    updatemenus=updatemenus,  # ボタンを設置
)

# グラフの表示
fig = go.Figure(data=plot, layout=layout)
fig.show()

# グラフの保存
prefix = 'plotly-buttons'
save_name = f"{prefix}_5data"
pio.orca.config.executable = '/Applications/orca.app/Contents/MacOS/orca'
pio.write_html(fig, f"{save_name}.html")
pio.write_image(fig, f"{save_name}.png")
複数プロットを同時に表示・非表示にする
ここまでは1ボタンで1つのプロットだけを表示したが、もちろん複数のプロットを同時に表示・非表示にすることも可能。単にvisibleでTrueとFalseを調節したらいいだけ。
ここでは以下の組み合わせでプロットを作成した。
all:全プロットを表示button1:奇数番目のプロットを表示button2:偶数番目のプロットを表示button3:最後の1プロット以外を表示
import numpy as np
import plotly.graph_objects as go
import plotly.io as pio

# 複数プロットを同時に表示する

x = np.arange(5)
ys = {}
for num in range(5):
    y = x + num  # y = x + bの形
    ys[f"x + {num}"] = y

# 配列の要素にプロット内容を格納
plot = []
colors = ('red', 'blue', 'green', 'orange', 'black')
for num, (name, y) in enumerate(ys.items()):
    d = go.Scatter(
        x=x, y=y, name=name,
        marker_color=colors[num],  # プロット線の色
        showlegend=True  # 凡例を常に表示
    )
    plot.append(d)

# 該当するプロットの位置をTrueにすると表示になる
visibles = dict(
    all=[True] * 5,  # 全プロット表示
    button1=[True, False, True, False, True],  # 奇数番目だけ
    button2=[False, True, False, True, False],  # 偶数番目だけ
    button3=[True, True, True, True, False]  # 最後以外を表示
)

# visiblesをforで回す
buttons = []
for label, visible in visibles.items():
    # ボタン作成
    button = dict(
        label=label,  # ボタンのラベル
        method='update',  # ボタンの適用範囲はデータプロットとレイアウト
        args=[
            dict(visible=visible),  # y1のみ表示
            dict(title=label),  # グラフタイトル
        ]
    )
    buttons.append(button)

# レイアウトに設置するためのupdatemenus作成
updatemenus = [
    dict(
        active=0,  # 初期グラフで見た目上、押されるボタン
        type='buttons',  # ボタンのタイプはボタンに
        direction='right',  # ボタンは右向きに配置
        x=0.5, y=1.01,  # ボタンの位置
        xanchor='center', yanchor='bottom',  # ボタンの位置の基準
        buttons=buttons,  # ここに設定したボタン情報を入れる
    )
]

# レイアウトの作成
layout = go.Layout(
    font_size=20,  # グラフ全体のフォントサイズ
    hoverlabel_font_size=20,  # ホバーのフォントサイズ
    yaxis_range=(-1, 9),  # 縦軸の表示範囲を固定
    updatemenus=updatemenus,  # ボタンを設置
)

# グラフの表示
fig = go.Figure(data=plot, layout=layout)
fig.show()

# グラフの保存
prefix = 'plotly-buttons'
save_name = f"{prefix}_5data_multiple"
pio.orca.config.executable = '/Applications/orca.app/Contents/MacOS/orca'
pio.write_html(fig, f"{save_name}.html")
pio.write_image(fig, f"{save_name}.png")
updateとrelayoutとrestyle
最後にupdatemenusで提供されている4つのmethodのうち、animateを除く3つを紹介する。
restyle:データまたはデータ属性の変更relayout:レイアウト属性の変更update:restyleとrelayoutの両方の変更が可能
restyleとrelayoutの両方を変更できるupdateが便利だが、updateの場合はargsの中にさらにdictを入れないといけないから複雑になる。
args=[
	dict(visible=visible),  # y1のみ表示
	dict(title=label),  # グラフタイトル
]
一方で、restyleとrelayoutの場合はデータもしくはレイアウトに関する変更しかできないのでargsの中がスッキリする。指定はlist形式で第一引数がdictのkey、第二引数がdictのvalueのような働きになる。
例えば公式ドキュメントのCustom Buttons in PythonのRestyle Buttonの項目では以下のように記述されている。
dict(
	args=["type", "surface"],
	label="3D Surface",
	method="restyle"
),
同じドキュメントのRelayout Buttonでも同様に以下のように記述されている。
dict(label="None",
	method="relayout",
	args=["shapes", []]
),
どちらもargsの中がlistなので短い記述で済んでいる。一方で、仮にmethod=’update’の場合だと以下のように記述しないといけない。
argsのdictは順番が決まっているので、特にupdateでrelayoutの処理だけをするときは注意が必要だ。データ部分に変更がないからといって一つ目の{}を飛ばすと正常なグラフができない。しかもエラーが出ないことも多々あるので不具合点を見つけるのも大変だ。
# Restyle Button
dict(
    args=[
        {"type", "surface"},  # restyleの部分
        {}  # relayoutの部分
    ],
    label="3D Surface",
    method="update"
),

#Relayout Button
dict(label="None",
     method="relayout",
     args=[
            {},  # restyleの部分
            {"shapes", []}  # relayoutの部分
     ]
),
なので必要に応じてupdateやrestyle、relayoutを使い分けるのが良い。無闇にupdateだけで進めると不具合につながる(実体験)。
動的グラフの魅力はボタンから
ということで、今回はPlotlyの大きな機能であるupdatemenusのボタンについて解説した。ボタン機能でプロットやレイアウトを変更することでより自由度の高いグラフを作成できる。
通常の静止画だと何枚も作成していたグラフを1枚で再現できるとなれば使い勝手が格段に上がるだろう。さらにPlotlyの場合はhtml形式で簡単に保存できるから後から開いてもすぐに動かせる。
これまで画像ファイルで動かせないとヤキモキしていた人は是非ともupdatemenusをマスターして色々な動かせるグラフを作成してほしい。
関連記事
-

-
【Plotly&ボタン】updatemenusのargs2で2回目のボタン押下機能を追加
今回はPlotlyのボタン機能に2回目のボタン押下の処理を追加& ...
続きを見る
-

-
【Plotlyで散布図】go.Scatterのグラフの描き方まとめ
これからPloltyで動くグラフを作りたい、もっとグラフをキ ...
続きを見る
-
-
【Plotly&sliders】スライダーを追加しデータを切り変える
本記事ではPlotlyでデータの流れを簡単に理解できる機能の ...
続きを見る
