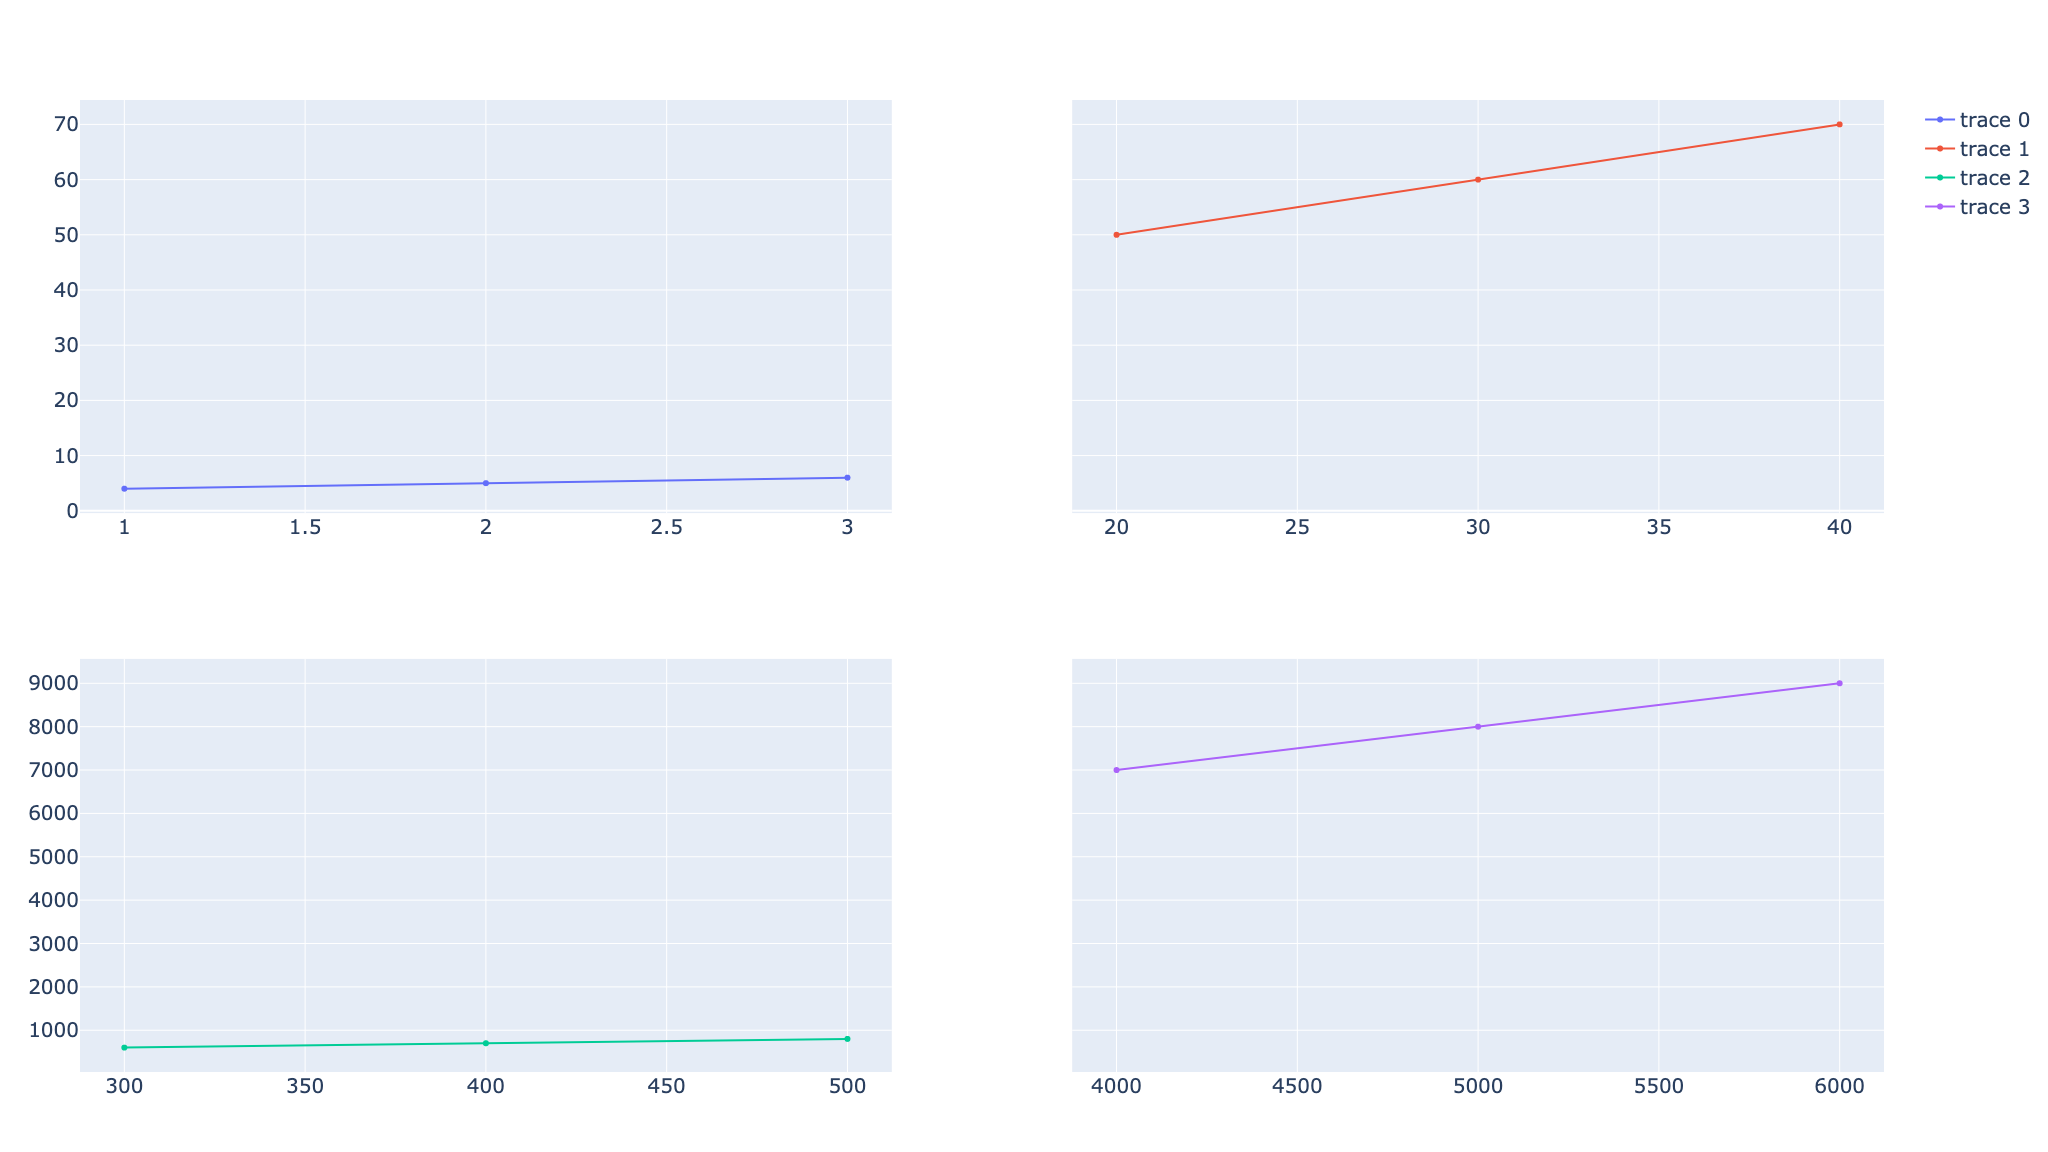
Plotlyで複数のグラフを1つのグラフとして表示するサブプロットを作成する方法を紹介する。主にfig.make_subplotsを使うが、domainやfig.set_subplotsを使う方法も解説する。
複数のグラフを同時に独立して表示させたい人はぜひとも読み進め、サブプロットを作成する方法を学んでほしい。
Python環境は以下。
- Python 3.10.8
- plotly 5.11.0
- plotly-orca 3.4.2
参考になるサイト
Plotly公式
その他
- Plotly 複数のグラフを並べて表示 (make_subplots, set_subplots) | AIリサーチコレクション
- Python Plotly入門 – 複数のグラフをプロット | 楽しみながら理解するAI・機械学習入門
本記事のコード全文
下準備のimport
from plotly.subplots import make_subplots
import plotly.graph_objects as go
import plotly.io as pio
まずは下準備としてのimport関連。本記事ではPlotlyのgoでサブプロットを作成するのによく使われるmake_subplotsを使用するのでimport。
その他はグラフ化するためのgoとグラフ保存用のpioをimportしている。goでグラフを作成する方法は以下からそれぞれの記事を確認できる。
goのグラフの記事は例えば散布図(scatter plot)のgo.Scatterや
-
-
【Plotlyで散布図】go.Scatterのグラフの描き方まとめ
これからPloltyで動くグラフを作りたい、もっとグラフをキ ...
続きを見る
Plotly特有のグラフにボタンをつける方法を記事にしている。
-
-
【Plotly&ボタン】updatemenusとbuttonsでボタン機能を追加
Plotlyはプロットしたデータを動かすことができるのが大き ...
続きを見る
cols指定でを横向きに左右に並べる
まずはサブプロットのグラフで複数のグラフを左右に並べる方法を紹介する。make_subplotsでは以下の2ステップでサブプロットを作成できる。
make_subplotsの引数で行(rows)と列(cols)の数を指定fig.add_traceでプロットを追加しつつrow,colを指定
2つのグラフを左右に並べる
2つのグラフを左右に並べる場合は行数が1で列数が2となる。なのでmake_subplotsもこれに沿うようにrowsとcolsの数値を指定。
figを作成できたらfig.add_traceでグラフ化するプロットを追加する。それぞれのプロットをどこに配置するかを指定するには引数rowとcolを使う。
from plotly.subplots import make_subplots
import plotly.graph_objects as go
import plotly.io as pio

# 1×2のサブプロットを作成
fig = make_subplots(rows=1, cols=2)

fig.add_trace(
    go.Scatter(x=[1, 2, 3], y=[4, 5, 6]),
    row=1, col=1  # 行1・列1にグラフを配置
)

fig.add_trace(
    go.Scatter(x=[20, 30, 40], y=[50, 60, 70]),
    row=1, col=2  # 行1・列2にグラフを配置
)

# グラフ全体とホバーのフォントサイズ変更
fig.update_layout(font_size=20, hoverlabel_font_size=20)
fig.show()

# グラフ保存
prefix = 'go-make-subplots'  # 保存ファイル名の接頭辞
save_name = f"{prefix}_2graphs_lr"
pio.orca.config.executable = '/Applications/orca.app/Contents/MacOS/orca'
pio.write_html(fig, f"{save_name}.html")
pio.write_image(fig, f"{save_name}.png")
3つ以上のグラフを左右に並べる
3つ以上のグラフを並べる場合も同様にmake_subplotsでサブプロットの行数と列数を指定し、fig.add_traceでプロットする位置を指定しながらプロットを追加する。
なお、make_subplotsで指定した列数にプロットを置かなかった場合、その領域にグラフが作成されることはない。上のグラフだと3列目にグラフを配置せずに空白にした。
from plotly.subplots import make_subplots
import plotly.graph_objects as go
import plotly.io as pio

# 3つ以上のグラフを左右に並べる

# 1×4のサブプロットを作成
fig = make_subplots(rows=1, cols=4)

fig.add_trace(
    go.Scatter(x=[1, 2, 3], y=[4, 5, 6]),
    row=1, col=1  # 行1・列1にグラフを配置
)

fig.add_trace(
    go.Scatter(x=[20, 30, 40], y=[50, 60, 70]),
    row=1, col=2  # 行1・列2にグラフを配置
)

fig.add_trace(
    go.Scatter(x=[300, 400, 500], y=[600, 700, 800]),
    row=1, col=4  # 行1・列4にグラフを配置
)

# グラフ全体とホバーのフォントサイズ変更
fig.update_layout(font_size=20, hoverlabel_font_size=20)
fig.show()

# グラフ保存
prefix = 'go-make-subplots'  # 保存ファイル名の接頭辞
save_name = f"{prefix}_3graphs_lr"
pio.orca.config.executable = '/Applications/orca.app/Contents/MacOS/orca'
pio.write_html(fig, f"{save_name}.html")
pio.write_image(fig, f"{save_name}.png")
make_subplotsの列数とグラフの列数は合わせる
# 2つのグラフを左右に並べる
fig = make_subplots(rows=1, cols=2)

fig.add_trace(
    go.Scatter(x=[300, 400, 500], y=[600, 700, 800]),
    row=1, col=3
)

Exception: The (row, col) pair sent is out of range. Use Figure.print_grid to view the subplot grid.
ただし、make_subplotsで指定した行数・列数を超えた数値をfig.add_traceで指定するとエラーになるので注意。
上の例では1行2列でサブプロットを作成したのに、3列目にグラフを置こうとしてエラーになった。
これは次に解説する上下に並べる時も同様だ。あくまでもmake_subplotsで指定した行数・列数を基準にプロットを追加する。
rows指定で縦向きに上下に並べる
続いてはmake_subplotsで行数を増やすことで、複数のグラフを上下に並べる方法を解説する。
上下に並べる場合は左右に並べる方法とほぼ同様、colsを複数にするかrowsを複数にするかの違いだけだ。
2つのグラフを上下に並べる
2つのグラフを上下に並べるにはmake_subplotsのrows=2に設定する。そしてfig.add_traceでプロットを追加する際に何行目に追加するのかを引数rowで指定する。
from plotly.subplots import make_subplots
import plotly.graph_objects as go
import plotly.io as pio

# 2つのグラフを上下に並べる

# 2×1のサブプロットを作成
fig = make_subplots(rows=2, cols=1)

fig.add_trace(
    go.Scatter(x=[1, 2, 3], y=[4, 5, 6]),
    row=1, col=1  # 行1・列1にグラフを配置
)

fig.add_trace(
    go.Scatter(x=[20, 30, 40], y=[50, 60, 70]),
    row=2, col=1  # 行2・列1にグラフを配置
)

# グラフ全体とホバーのフォントサイズ変更
fig.update_layout(font_size=20, hoverlabel_font_size=20)
fig.show()

# グラフ保存
prefix = 'go-make-subplots'  # 保存ファイル名の接頭辞
save_name = f"{prefix}_2graphs_tb"
pio.orca.config.executable = '/Applications/orca.app/Contents/MacOS/orca'
pio.write_html(fig, f"{save_name}.html")
pio.write_image(fig, f"{save_name}.png")
3つ以上のグラフを上下に並べる
3つ以上のグラフでサブプロットを作成する場合も同様にmake_subplotsで行数を指定しfig.add_traceでそれぞれのグラフの配置を決める。
また、グラフを配置しなかったサブプロットの位置は空白になる。上のグラフでは上から3番目の領域に何も配置しなかったので空白となっている。
from plotly.subplots import make_subplots
import plotly.graph_objects as go
import plotly.io as pio

# 3つ以上のグラフを上下に並べる

# 4×1のサブプロットを作成
fig = make_subplots(rows=4, cols=1)

fig.add_trace(
    go.Scatter(x=[1, 2, 3], y=[4, 5, 6]),
    row=1, col=1  # 行1・列1にグラフを配置
)

fig.add_trace(
    go.Scatter(x=[20, 30, 40], y=[50, 60, 70]),
    row=2, col=1  # 行2・列1にグラフを配置
)

fig.add_trace(
    go.Scatter(x=[300, 400, 500], y=[600, 700, 800]),
    row=4, col=1  # 行4・列1にグラフを配置
)

# グラフ全体とホバーのフォントサイズ変更
fig.update_layout(font_size=20, hoverlabel_font_size=20)
fig.show()

# グラフ保存
prefix = 'go-make-subplots'  # 保存ファイル名の接頭辞
save_name = f"{prefix}_3graphs_tb"
pio.orca.config.executable = '/Applications/orca.app/Contents/MacOS/orca'
pio.write_html(fig, f"{save_name}.html")
pio.write_image(fig, f"{save_name}.png")
グリッド形式にグラフを並べる
左右・上下単体でサブプロットを応用するとサブプロットをグリッド状に配置することも可能だ。
特に2×2のグリッド状のグラフはよく目にするのでここで作成方法を理解してほしい。
make_subplotsで行数と列数を指定して作成
2×2のグリッド状のサブプロットの場合make_subplotsでrows=2, cols=2と指定し、あとは最低4つのグラフをそれぞれの領域に配置するだけだ。
上のグラフでhmake_subplotsの引数start_cell="bottom-left"とすることでサブプロットの初めのプロット位置を左上から左下に変更している。
from plotly.subplots import make_subplots
import plotly.graph_objects as go
import plotly.io as pio

# 2×2のグラフを作成

fig = make_subplots(rows=2, cols=2, start_cell="bottom-left")

fig.add_trace(go.Scatter(x=[1, 2, 3], y=[4, 5, 6]), row=1, col=1)
fig.add_trace(go.Scatter(x=[20, 30, 40], y=[50, 60, 70]), row=1, col=2)
fig.add_trace(go.Scatter(x=[300, 400, 500], y=[600, 700, 800]), row=2, col=1)
fig.add_trace(go.Scatter(x=[4000, 5000, 6000], y=[7000, 8000, 9000]), row=2, col=2)

# グラフ全体とホバーのフォントサイズ変更
fig.update_layout(font_size=20, hoverlabel_font_size=20)
fig.show()

# グラフ保存
prefix = 'go-make-subplots'  # 保存ファイル名の接頭辞
save_name = f"{prefix}_grid"
pio.orca.config.executable = '/Applications/orca.app/Contents/MacOS/orca'
pio.write_html(fig, f"{save_name}.html")
pio.write_image(fig, f"{save_name}.png")
列の結合をしたグラフを作成
サブプロット内の全てのグラフの形状が同じではない場合もある。例えば上のグラフでは下段のグラフのサイズが1×2の横長だ。
このようにグラフを結合するにはmake_subplotsの引数specsで結合するプロットの設定が必要だ。
上のグラフでは下段の緑のグラフを1×2にしたいので{"colspan": 2}で2列を結合するように設定。
# colspanでグラフの結合
fig = make_subplots(
    rows=2, cols=2,
    specs=[
        [{}, {}],
        [{"colspan": 2}, None]
    ]
)
結合しないプロットは{}で何もしないことを指定し、結合によりプロットできなくなった領域はNoneを指定する。
もちろん引数specsを工夫することで、縦に長いグラフを作成することも可能だ。
from plotly.subplots import make_subplots
import plotly.graph_objects as go
import plotly.io as pio

# 列を結合したグラフを作成

# colspanでグラフの結合
fig = make_subplots(
    rows=2, cols=2,
    specs=[
        [{}, {}],
        [{"colspan": 2}, None]
    ]
)

fig.add_trace(go.Scatter(x=[1, 2], y=[1, 2]), row=1, col=1)
fig.add_trace(go.Scatter(x=[1, 2], y=[1, 2]), row=1, col=2)
fig.add_trace(go.Scatter(x=[1, 2, 3], y=[2, 1, 2]), row=2, col=1)

# グラフ全体とホバーのフォントサイズ変更
fig.update_layout(font_size=20, hoverlabel_font_size=20)
fig.show()

# グラフ保存
prefix = 'go-make-subplots'  # 保存ファイル名の接頭辞
save_name = f"{prefix}_grid_colspan"
pio.orca.config.executable = '/Applications/orca.app/Contents/MacOS/orca'
pio.write_html(fig, f"{save_name}.html")
pio.write_image(fig, f"{save_name}.png")
サブプロットのレイアウトをカスタム
ここまでで左右・上下・グリッド状にグラフをサブプロット形式で作成したが、まだグラフタイトルや軸ラベルを追加していない。
以下よりサブプロットのグラフのレイアウトをカスタムする方法を紹介する。
サブプロットにグラフタイトルをつける
まずはサブプロットのグラフ自体にタイトルをつける方法だ。サブプロットは複数のグラフが集まっているが、大きく見れば1つのグラフに過ぎない。
なので、通常のPlotlyのグラフタイトルをつける時と同様にfig.update_layoutでタイトルをつければ良い。
横軸・縦軸ラベルも同様の方法でつけることが可能だが、この場合は一番初めのプロット(xaxis1, yaxis1)に軸ラベルが付くことに注意。
from plotly.subplots import make_subplots
import plotly.graph_objects as go
import plotly.io as pio

# サブプロットにグラフタイトルをつける

fig = make_subplots(rows=1, cols=2)

fig.add_trace(go.Scatter(x=[1, 2, 3], y=[4, 5, 6]), row=1, col=1)
fig.add_trace(go.Scatter(x=[20, 30, 40], y=[50, 60, 70]), row=1, col=2)

# サブプロットのグラフタイトルと軸ラベル
fig.update_layout(
    title_text="Subplot Title",
    xaxis_title="x axis",
    yaxis_title="y axis",
)

# 軸ラベルはxaxis1とyaxis1についていることに注意
print(fig)
# Figure({
#     'data': [{'type': 'scatter', 'x': [1, 2, 3], 'xaxis': 'x', 'y': [4, 5, 6], 'yaxis': 'y'},
#              {'type': 'scatter', 'x': [20, 30, 40], 'xaxis': 'x2', 'y': [50, 60, 70], 'yaxis': 'y2'}],
#     'layout': {'template': '...',
#                'title': {'text': 'Subplot Title'},
#                'xaxis': {'anchor': 'y', 'domain': [0.0, 0.45], 'title': {'text': 'x axis'}},
#                'xaxis2': {'anchor': 'y2', 'domain': [0.55, 1.0]},
#                'yaxis': {'anchor': 'x', 'domain': [0.0, 1.0], 'title': {'text': 'y axis'}},
#                'yaxis2': {'anchor': 'x2', 'domain': [0.0, 1.0]}}
# })

# グラフ全体とホバーのフォントサイズ変更
fig.update_layout(font_size=20, hoverlabel_font_size=20)
fig.show()

# グラフ保存
prefix = 'go-make-subplots'  # 保存ファイル名の接頭辞
save_name = f"{prefix}_2graphs_title"
pio.orca.config.executable = '/Applications/orca.app/Contents/MacOS/orca'
pio.write_html(fig, f"{save_name}.html")
pio.write_image(fig, f"{save_name}.png")
それぞれのグラフにタイトルをつける
それぞれのサブプロットにタイトルをつける場合はmake_subplotsのsubplot_titlesで指定する必要があることに注意。
あくまでもサブプロットを作成しているのはmake_subplotsなので設定もmake_subplotsで行う。
なお、subplot_titlesに記載したが使用しなかったグラフタイトルは表示されない。
from plotly.subplots import make_subplots
import plotly.graph_objects as go
import plotly.io as pio

# それぞれのグラフにタイトルをつける

# subplot_titlesでそれぞれのグラフにタイトルをつける
# 余ったタイトルは使用されない
fig = make_subplots(
    rows=1, cols=2,
    subplot_titles=("Plot 1", "Plot 2", "Plot 3", "Plot 4")
)

fig.add_trace(go.Scatter(x=[1, 2, 3], y=[4, 5, 6]), row=1, col=1)
fig.add_trace(go.Scatter(x=[20, 30, 40], y=[50, 60, 70]), row=1, col=2)

# グラフ全体とホバーのフォントサイズ変更
fig.update_layout(font_size=20, hoverlabel_font_size=20)
fig.show()

# グラフ保存
prefix = 'go-make-subplots'  # 保存ファイル名の接頭辞
save_name = f"{prefix}_2graphs_subplot_titles"
pio.orca.config.executable = '/Applications/orca.app/Contents/MacOS/orca'
pio.write_html(fig, f"{save_name}.html")
pio.write_image(fig, f"{save_name}.png")
それぞれのグラフに軸ラベルをつける
続いてはそれぞれのグラフに軸ラベルをつける方法だが、こちらは2種類の方法がある。
fig.update_xaxesで行・列を指定fig.update_layoutで軸を指定
fig.update_xaxesではrow, colで行と列を指定することでどこに軸ラベルを追加するかを指定できる。
一方で、fig.update_layoutではyaxis1のように数字を指定することで直接、軸ラベルを追加することができる。
以下のコードでわかるように、x軸ラベルはfig.update_xaxesで、y軸ラベルはfig.update_layoutで指定し
た。
from plotly.subplots import make_subplots
import plotly.graph_objects as go
import plotly.io as pio

# それぞれのグラフに軸ラベルをつける

fig = make_subplots(rows=1, cols=2)

fig.add_trace(go.Scatter(x=[1, 2, 3], y=[4, 5, 6]), row=1, col=1)
fig.add_trace(go.Scatter(x=[20, 30, 40], y=[50, 60, 70]), row=1, col=2)

# update_xaxesとrow・colの指定で変更することが可能
fig.update_xaxes(title_text="xaxis 1 title", row=1, col=1)
fig.update_xaxes(title_text="xaxis 2 title", row=1, col=2)

# axisと数字で変更することも可能
fig.update_layout(
    yaxis1_title='yaxis 1 title',
    yaxis2_title='yaxis 2 title',
)

# グラフ全体とホバーのフォントサイズ変更
fig.update_layout(font_size=20, hoverlabel_font_size=20)
fig.show()

# グラフ保存
prefix = 'go-make-subplots'  # 保存ファイル名の接頭辞
save_name = f"{prefix}_2graphs_axis_title"
pio.orca.config.executable = '/Applications/orca.app/Contents/MacOS/orca'
pio.write_html(fig, f"{save_name}.html")
pio.write_image(fig
プロット点に注釈をつける
各プロット点に注釈をつけるにはgo.Scatterの引数textが便利。詳しくは以下のgo.Scatterの記事で解説している。
-

-
【Plotlyで散布図】go.Scatterのグラフの描き方まとめ
これからPloltyで動くグラフを作りたい、もっとグラフをキ ...
続きを見る
引数modeでテキストを使用可能にすることでプロットにテキストを追加することができる。
上のサブプロットでは左のグラフにテキストを、右のグラフでyの値を表示した。プロットの値を表示するにはあらかじめプロットの値を変数に入れる必要があるので注意。
from plotly.subplots import make_subplots
import plotly.graph_objects as go
import plotly.io as pio

# プロット点に注釈をつける

fig = make_subplots(rows=1, cols=2)

fig.add_trace(
    go.Scatter(
        x=[1, 2, 3], y=[4, 5, 6],
        mode="markers+text",  # プロットのモードをマーカーとテキストにする
        text=["Text A", "Text B", "Text C"],  # 表示したい注釈を記載
    ),
    row=1, col=1
)

y = [50, 60, 70]
fig.add_trace(
    go.Scatter(
        x=[20, 30, 40], y=y,
        mode="markers+text",  # プロットのモードをマーカーとテキストにする
        text=y,  # 表示したい注釈を記載
    ),
    row=1, col=2
)

# グラフ全体とホバーのフォントサイズ変更
fig.update_layout(font_size=20, hoverlabel_font_size=20)
fig.show()

# グラフ保存
prefix = 'go-make-subplots'  # 保存ファイル名の接頭辞
save_name = f"{prefix}_2graphs_text"
pio.orca.config.executable = '/Applications/orca.app/Contents/MacOS/orca'
pio.write_html(fig, f"{save_name}.html")
pio.write_image(fig, f"{save_name}.png")
プロットの範囲やグリッドの表示を変更
サブプロットでは複数のグラフを表示できるが、それぞれのグラフに対して別々でレイアウトを変更することが可能だ。
上のサブプロットでは、左右のグラフでそれぞれ別のレイアウト変更を行った。
- 左のグラフ
- 横軸の範囲を
0~8に指定 - 縦軸をlog形式で表示
- 横軸の範囲を
- 右のグラフ
- 横軸のグリッドを非表示
- 縦軸のグリッドをオレンジの点線に変更
もちろん他にも色々とカスタムすることができるので、Plotly公式のレイアウトのページから探ってほしい。
from plotly.subplots import make_subplots
import plotly.graph_objects as go
import plotly.io as pio

# プロット範囲やグリッドの表示を変更

fig = make_subplots(rows=1, cols=2)

fig.add_trace(go.Scatter(x=[1, 2, 3], y=[4, 5, 6]), row=1, col=1)
fig.add_trace(go.Scatter(x=[20, 30, 40], y=[50, 60, 70]), row=1, col=2)

fig.update_layout(
    xaxis=dict(range=(0, 8)),
    xaxis2=dict(showgrid=False),
    yaxis=dict(type="log"),
    yaxis2=dict(gridcolor="orange", griddash="dot"),
)

# グラフ全体とホバーのフォントサイズ変更
fig.update_layout(font_size=20, hoverlabel_font_size=20)
fig.show()

# グラフ保存
prefix = 'go-make-subplots'  # 保存ファイル名の接頭辞
save_name = f"{prefix}_2graphs_axis_custom"
pio.orca.config.executable = '/Applications/orca.app/Contents/MacOS/orca'
pio.write_html(fig, f"{save_name}.html")
pio.write_image(fig, f"{save_name}.png")
サブプロットの列の幅と行の高さを変更
サブプロット内のそれぞれのグラフの幅や高さを変更することも可能だ。上のグラフでは7:3の比率になるように調節した。
make_subplotsの引数column_widthsを指定することで列の幅を、row_heightsを指定することで行の高さを変更できる。
なお、合計値が1にならなくても初めの値を基準に残りの値が自動で調節される。
from plotly.subplots import make_subplots
import plotly.graph_objects as go
import plotly.io as pio

# プロット範囲やグリッドの表示を変更

fig = make_subplots(rows=1, cols=2, column_widths=[0.7, 0.3])

fig.add_trace(go.Scatter(x=[1, 2, 3], y=[4, 5, 6]), row=1, col=1)
fig.add_trace(go.Scatter(x=[20, 30, 40], y=[50, 60, 70]), row=1, col=2)

# グラフ全体とホバーのフォントサイズ変更
fig.update_layout(font_size=20, hoverlabel_font_size=20)
fig.show()

# グラフ保存
prefix = 'go-make-subplots'  # 保存ファイル名の接頭辞
save_name = f"{prefix}_2graphs_column_widths"
pio.orca.config.executable = '/Applications/orca.app/Contents/MacOS/orca'
pio.write_html(fig, f"{save_name}.html")
pio.write_image(fig, f"{save_name}.png")
x軸・y軸を共有するサブプロット
サブプロットの内のグラフで横軸・縦軸を共有することが可能だ。make_subplotsの引数shared_xaxesで横軸を、shared_yaxesで縦軸を共有するか否かを決められる。
上のグラフではshared_yaxes=Trueとして縦軸だけ共有した。
from plotly.subplots import make_subplots
import plotly.graph_objects as go
import plotly.io as pio

# 共通の軸を持つサブプロット

# shared_yaxesで軸を共有する設定をする
fig = make_subplots(rows=2, cols=2, shared_yaxes=True)

fig.add_trace(go.Scatter(x=[1, 2, 3], y=[4, 5, 6]), row=1, col=1)
fig.add_trace(go.Scatter(x=[20, 30, 40], y=[50, 60, 70]), row=1, col=2)
fig.add_trace(go.Scatter(x=[300, 400, 500], y=[600, 700, 800]), row=2, col=1)
fig.add_trace(go.Scatter(x=[4000, 5000, 6000], y=[7000, 8000, 9000]), row=2, col=2)
# グラフ全体とホバーのフォントサイズ変更
fig.update_layout(font_size=20, hoverlabel_font_size=20)
fig.show()

# グラフ保存
prefix = 'go-make-subplots'  # 保存ファイル名の接頭辞
save_name = f"{prefix}_grid_shared_yaxes"
pio.orca.config.executable = '/Applications/orca.app/Contents/MacOS/orca'
pio.write_html(fig, f"{save_name}.html")
pio.write_image(fig, f"{save_name}.png")
goとlayoutのdomainでサブプロット
ここまでmake_subplotsを使用してサブプロッtを作成する方法を解説したが、goを使ってもサブプロットを作成できる。
make_subplotsのように短いコードで作成はできないが、その分、自分が作成したいようにカスタムすることが可能だ。
手順は以下の2ステップで可能だ。
go.Scatterなどの引数xaxis,yaxisで軸を決めるgo.Layoutの各軸の設定の引数domainでグラフの位置を決める
2つのグラフをdomainで左右に並べる
goでサブプロットを作成するにはgoのプロットの引数xaxis, yaxisでどの軸に対してプロットするのか指定する。
上のサブプロットでは右のグラフをxaxis=”x2”、yaxis="y2"と指定しxaxis2でグラフを作成する位置を指定した。また、y2軸の基準はx2にして独立させた。
左のグラフのdomain=[0, 0.7]はx=0~0.7の範囲でグラフ作成、右のグラフのdomain=[0.8, 1]はx=0.8~1.0の間でグラフを作成するという意味だ。
from plotly.subplots import make_subplots
import plotly.graph_objects as go
import plotly.io as pio

# 2つのグラフをdomainで左右に並べる

trace1 = go.Scatter(x=[1, 2, 3], y=[4, 5, 6])
# 2つ目のグラフの基準はx2とy2に指定
trace2 = go.Scatter(x=[20, 30, 40], y=[50, 60, 70], xaxis="x2", yaxis="y2")
data = [trace1, trace2]

# domainでグラフの開始位置を指定
layout = go.Layout(
    xaxis=dict(domain=[0, 0.7]),
    xaxis2=dict(domain=[0.8, 1]),
    yaxis2=dict(anchor="x2")  # y2の基準はx2に指定
)

fig = go.Figure(data=data, layout=layout)
# グラフ全体とホバーのフォントサイズ変更
fig.update_layout(font_size=20, hoverlabel_font_size=20)
fig.show()

# グラフ保存
prefix = 'go-make-subplots'  # 保存ファイル名の接頭辞
save_name = f"{prefix}_domain_lr"
pio.orca.config.executable = '/Applications/orca.app/Contents/MacOS/orca'
pio.write_html(fig, f"{save_name}.html")
pio.write_image(fig, f"{save_name}.png")
2つのグラフをdomainで上下に並べる
グラフを上下に分割するときも同様にdomainの値を調節することでサブプロットを作成することができる。
ここではy=0~0.7を下のグラフ、y=0.8~1.0を上のグラフとして設定した。
from plotly.subplots import make_subplots
import plotly.graph_objects as go
import plotly.io as pio

# 2つのグラフをdomainで上下に並べる

trace1 = go.Scatter(x=[1, 2, 3], y=[4, 5, 6])
# 2つ目のグラフの基準はx2とy2に指定
trace2 = go.Scatter(x=[20, 30, 40], y=[50, 60, 70], xaxis="x2", yaxis="y2")
data = [trace1, trace2]

# domainでグラフの開始位置を指定
layout = go.Layout(
    xaxis2=dict(anchor="y2"),  # x2の基準はy2に指定
    yaxis=dict(domain=[0, 0.7]),
    yaxis2=dict(domain=[0.8, 1])
)

fig = go.Figure(data=data, layout=layout)
# グラフ全体とホバーのフォントサイズ変更
fig.update_layout(font_size=20, hoverlabel_font_size=20)
fig.show()

# グラフ保存
prefix = 'go-make-subplots'  # 保存ファイル名の接頭辞
save_name = f"{prefix}_domain_tb"
pio.orca.config.executable = '/Applications/orca.app/Contents/MacOS/orca'
pio.write_html(fig, f"{save_name}.html")
pio.write_image(fig, f"{save_name}.png")
グリッド形式にグラフを並べる
グリッド状に配置する場合はそれぞれの軸の開始位置を把握することが重要だ。上の例では左下から右下、右上、左上の順番にプロットした。
この順番に応じてdomainを設定する必要がある。
from plotly.subplots import make_subplots
import plotly.graph_objects as go
import plotly.io as pio

# 4つのグラフをdomainでグリッドで並べる
trace1 = go.Scatter(x=[1, 2, 3], y=[4, 5, 6])
trace2 = go.Scatter(x=[20, 30, 40], y=[50, 60, 70], xaxis="x2", yaxis="y2")
trace3 = go.Scatter(x=[300, 400, 500], y=[600, 700, 800], xaxis="x3", yaxis="y3")
trace4 = go.Scatter(x=[4000, 5000, 6000], y=[7000, 8000, 9000], xaxis="x4", yaxis="y4")
data = [trace1, trace2, trace3, trace4]

layout = go.Layout(
    # 右に配置するのはx2, x4
    xaxis=dict(domain=[0, 0.45]),
    xaxis2=dict(domain=[0.55, 1], anchor="y2"),
    xaxis3=dict(domain=[0, 0.45], anchor="y3"),
    xaxis4=dict(domain=[0.55, 1], anchor="y4"),
    # 上に配置するのはy3, y4
    yaxis=dict(domain=[0, 0.45]),
    yaxis2=dict(domain=[0, 0.45], anchor="x2"),
    yaxis3=dict(domain=[0.55, 1], anchor="x3"),
    yaxis4=dict(domain=[0.55, 1], anchor="x4")
)

fig = go.Figure(data=data, layout=layout)
# グラフ全体とホバーのフォントサイズ変更
fig.update_layout(font_size=20, hoverlabel_font_size=20)
fig.show()

# グラフ保存
prefix = 'go-make-subplots'  # 保存ファイル名の接頭辞
save_name = f"{prefix}_domain_grid"
pio.orca.config.executable = '/Applications/orca.app/Contents/MacOS/orca'
pio.write_html(fig, f"{save_name}.html")
pio.write_image(fig, f"{save_name}.png")
domainでx軸を共有して積み重ねる
domainを使用した場合も軸を共有することが可能だ。それぞれのプロットで引数yaxisだけ指定し、xaxisを指定しなかった場合は横軸を共有することができる。
なお、上のグラフではそれぞれのグラフのdomainをつなげるように指定したので、グラフの枠線が消えている。
from plotly.subplots import make_subplots
import plotly.graph_objects as go
import plotly.io as pio

# domainでx軸を共有

# x軸は共通、y軸はそれぞれのグラフで別にする
trace1 = go.Scatter(x=[0, 1, 2], y=[10, 11, 12])
trace2 = go.Scatter(x=[2, 3, 4], y=[100, 110, 120], yaxis="y2")
trace3 = go.Scatter(x=[3, 4, 5], y=[1000, 1100, 1200], yaxis="y3")
data = [trace1, trace2, trace3]

layout = go.Layout(
    legend=dict(traceorder="reversed"),  # 凡例の並びをプロットに合わせる
    # domainの値をつなげるとグラフの枠が消える
    yaxis=dict(domain=[0, 0.33]),
    yaxis2=dict(domain=[0.33, 0.66]),
    yaxis3=dict(domain=[0.66, 1])
)

fig = go.Figure(data=data, layout=layout)
# グラフ全体とホバーのフォントサイズ変更
fig.update_layout(font_size=20, hoverlabel_font_size=20)
fig.show()

# グラフ保存
prefix = 'go-make-subplots'  # 保存ファイル名の接頭辞
save_name = f"{prefix}_domain_share_yaxis"
pio.orca.config.executable = '/Applications/orca.app/Contents/MacOS/orca'
pio.write_html(fig, f"{save_name}.html")
pio.write_image(fig, f"{save_name}.png")
set_subplotsで既存のグラフにサブプロットを追加
最後に既存のfigをサブプロット化できるfig.set_subplotsを紹介する。fig.set_subplotsはPlotlyのバージョン4.13から追加されたサブプロットの作成方法だ。
fig.add_tracesからサブプロットを作成
まずは先にfigを作成し、このfigにfig.add_tracesでプロットを追加してからサブプロットを作成する方法を解説。
サブプロットでx2, y2以降の軸でグラフ化したいプロットでxaxis, yaxisを指定しfigを作成、最後にfig.set_subplotsでサブプロットの設定をすると簡単に作成できる。
なお、サブプロットの各グラフの間隔はhorizontal_spacingで指定可能だ。
from plotly.subplots import make_subplots
import plotly.graph_objects as go
import plotly.io as pio

# 先にfigを作成
fig = go.Figure()

fig.add_traces((
    go.Scatter(x=[1, 2, 3], y=[4, 5, 6]),
    go.Scatter(x=[20, 30, 40], y=[50, 60, 70], xaxis="x2", yaxis="y2")
))

print(fig)
# Figure({
#     'data': [{'type': 'scatter', 'x': [1, 2, 3], 'y': [4, 5, 6]},
#              {'type': 'scatter', 'x': [20, 30, 40], 'xaxis': 'x2', 'y': [50, 60, 70], 'yaxis': 'y2'}],
#     'layout': {'template': '...'}
# })

# 後からサブプロットの設定
fig.set_subplots(1, 2, horizontal_spacing=0.1)
print(fig)
# Figure({
#     'data': [{'type': 'scatter', 'x': [1, 2, 3], 'y': [4, 5, 6]},
#              {'type': 'scatter', 'x': [20, 30, 40], 'xaxis': 'x2', 'y': [50, 60, 70], 'yaxis': 'y2'}],
#     'layout': {'template': '...',
#                'xaxis': {'anchor': 'y', 'domain': [0.0, 0.45]},
#                'xaxis2': {'anchor': 'y2', 'domain': [0.55, 1.0]},
#                'yaxis': {'anchor': 'x', 'domain': [0.0, 1.0]},
#                'yaxis2': {'anchor': 'x2', 'domain': [0.0, 1.0]}}
# })

# グラフ全体とホバーのフォントサイズ変更
fig.update_layout(font_size=20, hoverlabel_font_size=20)
fig.show()

# グラフ保存
prefix = 'go-make-subplots'  # 保存ファイル名の接頭辞
save_name = f"{prefix}_domain_set_subplots"
pio.orca.config.executable = '/Applications/orca.app/Contents/MacOS/orca'
pio.write_html(fig, f"{save_name}.html")
pio.write_image(fig, f"{save_name}.png")
traceをdataで入れてからサブプロット作成
また、あらかじめプロットを作成し、go.Figureの引数dataに直接入れてからサブプロットを作成することも可能だ。
先ほどのfig.add_tracesとやっていることは同じなので結果も同じなる。
from plotly.subplots import make_subplots
import plotly.graph_objects as go
import plotly.io as pio

# traceをdataで入れてからサブプロット作成

trace1 = go.Scatter(x=[1, 2, 3], y=[4, 5, 6])
trace2 = go.Scatter(x=[20, 30, 40], y=[50, 60, 70], xaxis="x2", yaxis="y2")
data = [trace1, trace2]

fig = go.Figure(data=data)
# 後からサブプロットの設定
fig.set_subplots(1, 2, horizontal_spacing=0.1)

# グラフ全体とホバーのフォントサイズ変更
fig.update_layout(font_size=20, hoverlabel_font_size=20)
fig.show()

# グラフ保存
prefix = 'go-make-subplots'  # 保存ファイル名の接頭辞
save_name = f"{prefix}_domain_set_subplots_data"
pio.orca.config.executable = '/Applications/orca.app/Contents/MacOS/orca'
pio.write_html(fig, f"{save_name}.html")
pio.write_image(fig, f"{save_name}.png")
複数のグラフを同時に動かせるようにする
今回はPlotlyのmake_subplotsを中心にサブプロットのグラフを作成する方法を解説した。複数のグラフを動かしながら比較できるのでぜひマスターしてほしい。
サブプロット以外にもPlotlyのグラフにupdatemenusでボタンを追加する記事や
-

-
【Plotly&ボタン】updatemenusとbuttonsでボタン機能を追加
Plotlyはプロットしたデータを動かすことができるのが大き ...
続きを見る
-
-
【Plotly&ボタン】updatemenusのargs2で2回目のボタン押下機能を追加
今回はPlotlyのボタン機能に2回目のボタン押下の処理を追加& ...
続きを見る
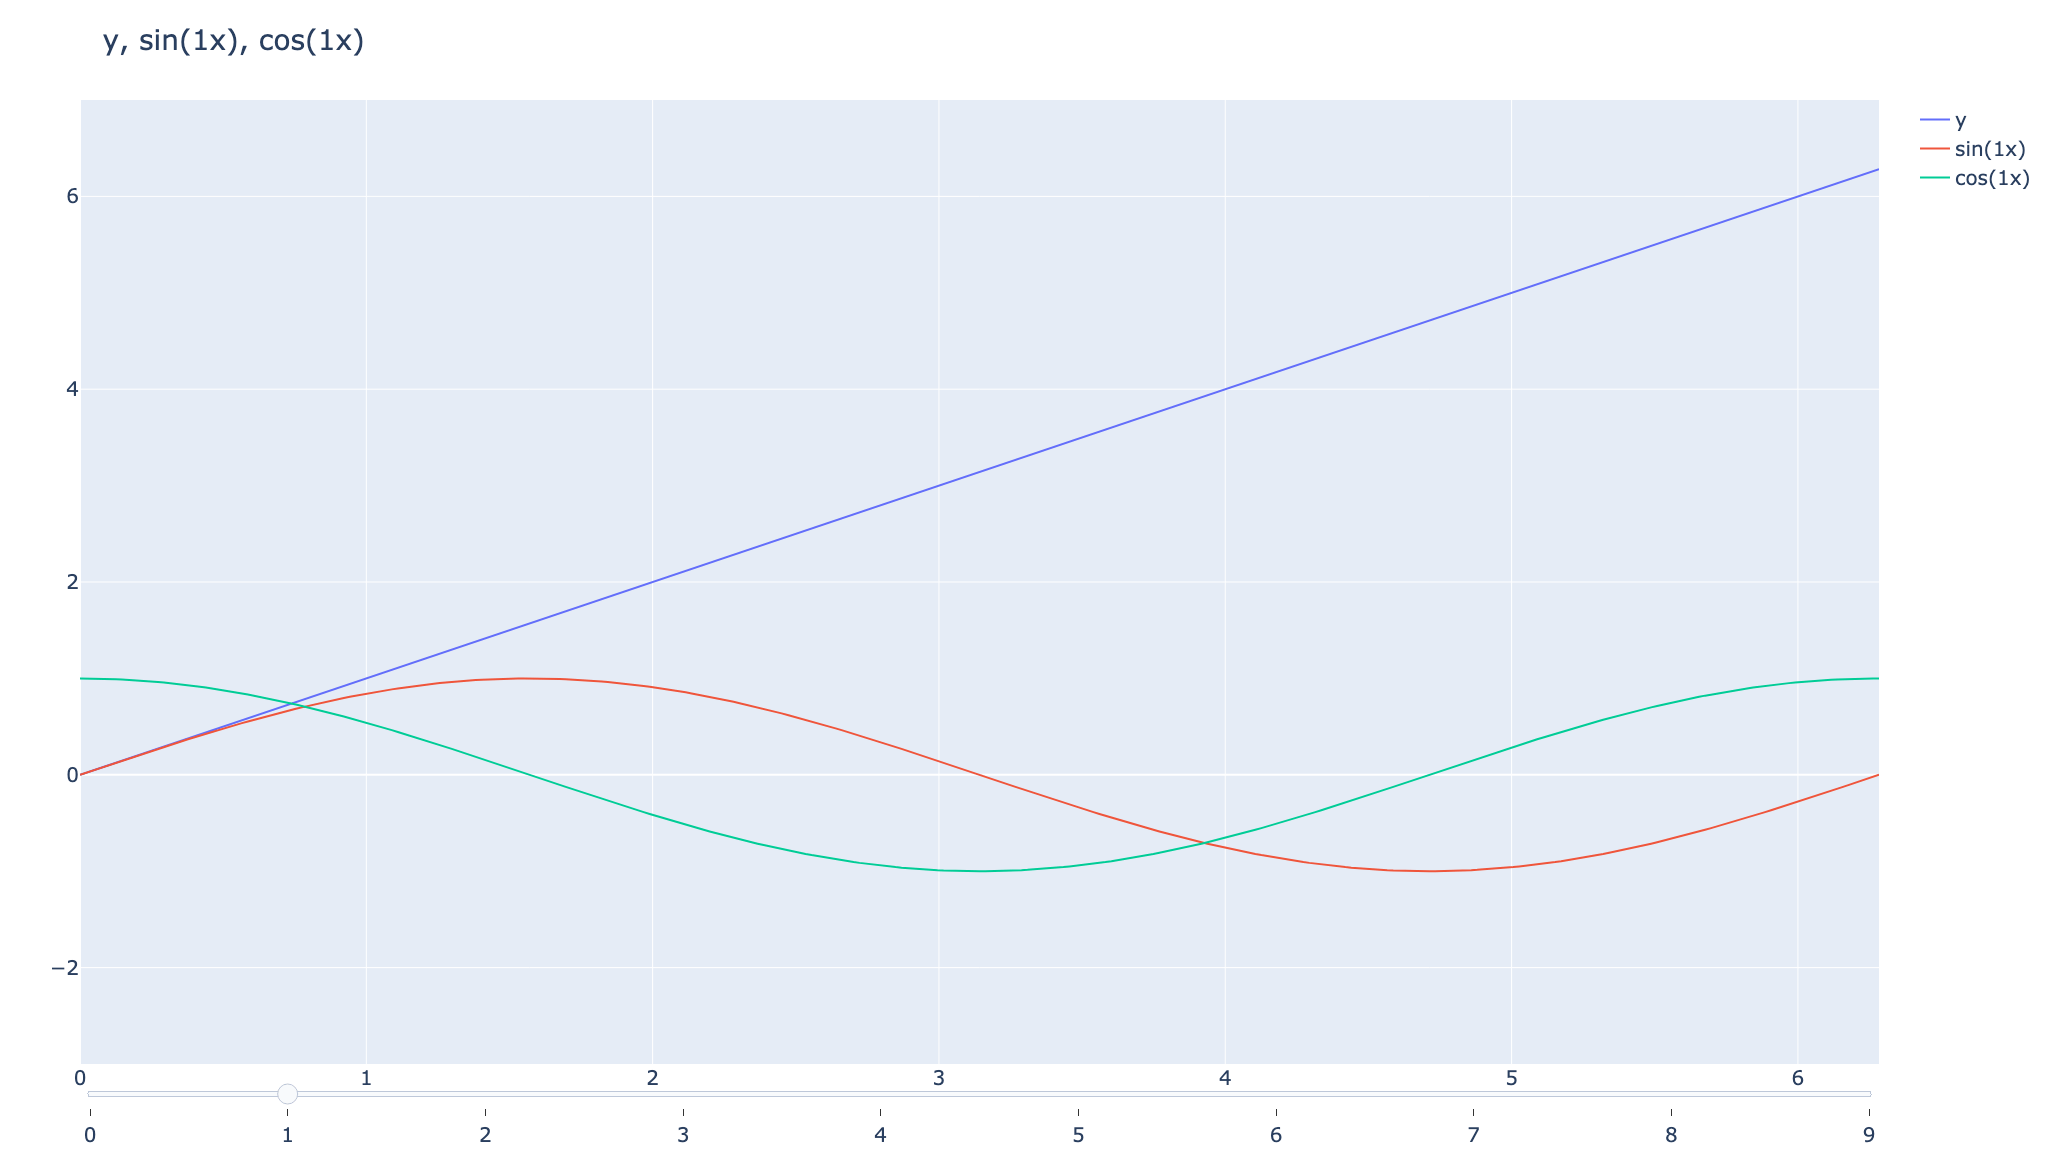
グラフにslidersでスライダー機能を追加する記事もある。どれもPlotly特有のインタラクティブなグラフだ。
-
-
【Plotly&sliders】スライダーを追加しデータを切り変える
本記事ではPlotlyでデータの流れを簡単に理解できる機能の ...
続きを見る
より便利にPlotlyを使いたい人は併せて学んでほしい。
