今回はPlotlyのボタン機能に2回目のボタン押下の処理を追加する方法を解説する。この機能を使うことで、1つのボタンに2種類の機能を付与してボタンの数を減らすことができるだろう。
また、オン・オフの切り替えを1つのボタンで担うことができるので、機能面でもわかりやすくなるだろう。
本記事の内容は以下のupdatemenusでボタンを追加する方法の応用版だ。まだ読んでいない人はまずは基礎固めから始めてほしい。
-
-
【Plotly&ボタン】updatemenusとbuttonsでボタン機能を追加
Plotlyはプロットしたデータを動かすことができるのが大き ...
続きを見る
Python環境は以下。
- Python 3.10.8
- numpy 1.24.0
- plotly 5.11.0
- plotly-orca 3.4.2
参考になるサイト
Plotly公式
StackOverflow
本記事のコード全文
下準備のimport
import plotly.graph_objects as go
import plotly.io as pio
まずは下準備としてのimport関連。今回は基本goを使用する。pioはplotlyでのグラフ保存用のライブラリ。保存の仕方は色々あるがpioはその1つだ。
(復習)グラフにボタンを追加する
まずはupdatemenusでボタンを追加する記事で解説・作成したボタン機能付きのグラフを作成。ボタンは合計3種類で以下の機能がある。
all:y1,y2を表示y1:y1だけ表示、y2は非表示y1:y2だけ表示、y1は非表示
詳しくは以下の記事を参照いただきたいが、グラフにボタンを追加するざっくりとした手順は以下。
- ボタン処理(
button_all,button1,button2)を作成 - 作成したボタン処理を配列に入れる(
buttons) - ボタン自体の設定(
updatemenus) updatemenusをレイアウトに入れる
ここで作成したボタンは一度押せば他のボタンを押さない限り再度機能することはない。しかし、以降で解説するargs2を使用することでもう一度押した時の処理を追加できる。
import plotly.graph_objects as go
import plotly.io as pio

# (復習)2つのグラフを切り替えられるボタンを作成

x = (0, 1, 2, 3, 4)
y1 = (0, 1, 4, 3, 2)
y2 = (1, 3, 2, 4, 0)

# 配列の要素にプロット内容を格納
plot = [
    go.Scatter(x=x, y=y1, name='y1'),
    go.Scatter(x=x, y=y2, name='y2'),
]

# 2プロット表示用のボタン作成
button_all = dict(
    label='all',  # ボタンのラベル
    method='update',  # ボタンの適用範囲はデータプロットとレイアウト
    args=[
        dict(visible=[True, True]),  # y1, y2の両方を表示
        dict(title='all plots'),  # グラフタイトル
    ]
)
# y1表示用のボタン作成
button1 = dict(
    label='y1',  # ボタンのラベル
    method='update',  # ボタンの適用範囲はデータプロットとレイアウト
    args=[
        dict(visible=[True, False]),  # y1のみ表示
        dict(title='y1 plot'),  # グラフタイトル
    ]
)
# y2表示用のボタン作成
button2 = dict(
    label='y2',  # ボタンのラベル
    method='update',  # ボタンの適用範囲はデータプロットとレイアウト
    args=[
        dict(visible=[False, True]),  # y2のみ表示
        dict(title='y2 plot'),  # グラフタイトル
    ]
)

# ボタンをひとまとめにする
buttons = [button_all, button1, button2]

# レイアウトに設置するためのupdatemenus作成
updatemenus = [
    dict(
        active=0,  # 初期グラフで見た目上、押されるボタン
        type='buttons',  # ボタンのタイプはボタンに
        direction='right',  # ボタンは右向きに配置
        x=0.5, y=1.01,  # ボタンの位置
        xanchor='center', yanchor='bottom',  # ボタンの位置の基準
        buttons=buttons,  # ここに設定したボタン情報を入れる
    )
]

# レイアウトの作成
layout = go.Layout(
    font_size=20,  # グラフ全体のフォントサイズ
    hoverlabel_font_size=20,  # ホバーのフォントサイズ
    updatemenus=updatemenus,  # ボタンを設置
)

# グラフの表示
fig = go.Figure(data=plot, layout=layout)
fig.show()

# グラフの保存
prefix = 'plotly-buttons-args2'
save_name = f"{prefix}_simple_buttons"
pio.orca.config.executable = '/Applications/orca.app/Contents/MacOS/orca'
pio.write_html(fig, f"{save_name}.html")
pio.write_image(fig, f"{save_name}.png")
args2で2回目のボタン押下を有効に
同じボタン2回押して際に別の処理をつけるにはボタン処理(buttons_allなど)に引数args2を使えば良い。使い方はargsと同じで、単に処理が走るタイミングが異なるだけ。
ここでは以下の状態になるようにグラフを作成した。
args(1回目のボタン押下):y1,y2非表示args2(2回目のボタン押下):y1,y2表示
表示・非表示はargsの1つ目のdict内でvisibleを使って指定すれば良い。y1, y2の順番でプロットしているので、visibleの1つ目の要素をFalseにするとy1が非表示になる。一方でTrueにすると表示される。
argsは最初にボタンを押した時の挙動なので、ここでは最初にy1, y2を表示していることを踏まえvisible=[False, False]にして非表示にした。
dict(visible=[False, False]),
ただし、argsでプロットを非表示にしている場合はupdatemenusの引数acriveを-1にする必要がある。active=0にするとすでにargsのボタンが押された状態になるからだ。
逆にargsでプロットを表示(visible=[True, True])にしたなら、初期状態ですでに1回目のボタンを押していることと同義なのでactive=0にする必要がある。
少しややこしいが以下のイメージだ。
active=-1- ボタンは押されていない状態
- 最初に押した時に
visible=Falseに
active=0- ボタンは1回押されている状態
- 最初に押した時に
visible=Trueに
よくわからなかった場合はvisibleとactiveの値を変えて色々とチャレンジしてほしい。実際に手を動かすのが一番の近道だ。
import plotly.graph_objects as go
import plotly.io as pio

# 2つのプロットを2種類の機能を持つボタンで切り替える

x = (0, 1, 2, 3, 4)
y1 = (0, 1, 4, 3, 2)
y2 = (1, 3, 2, 4, 0)

# 配列の要素にプロット内容を格納
plot = [
    go.Scatter(x=x, y=y1, name='y1'),
    go.Scatter(x=x, y=y2, name='y2'),
]

# args2を適用し全プロット表示と全プロット非表示のボタンを追加
button_all = dict(
    label='all or nothing',  # ボタンのラベル
    method='update',  # ボタンの適用範囲はデータプロットとレイアウト
    # aegsを1回押した時のボタンの挙動
    args=[
        dict(visible=[False, False]),  # y1, y2の両方を表示
        dict(title='No plots'),  # グラフタイトル
    ],
    # aegs2がもう一回押した時のボタンの挙動
    args2=[
        dict(visible=[True, True]),  # y1, y2の両方を表示
        dict(title='all plots'),  # グラフタイトル
    ]
)

# ボタンをlistにまとめる
buttons = [button_all]

# レイアウトに設置するためのupdatemenus作成
updatemenus = [
    dict(
        # active=0にしていると、args2のボタンがすでに一度押された扱いになる
        active=-1,  # 初期グラフで見た目上、押されるボタン
        type='buttons',  # ボタンのタイプはボタンに
        direction='right',  # ボタンは右向きに配置
        x=0.5, y=1.01,  # ボタンの位置
        xanchor='center', yanchor='bottom',  # ボタンの位置の基準
        buttons=buttons,  # ここに設定したボタン情報を入れる
    )
]

# レイアウトの作成
layout = go.Layout(
    font_size=20,  # グラフ全体のフォントサイズ
    hoverlabel_font_size=20,  # ホバーのフォントサイズ
    updatemenus=updatemenus,  # ボタンを設置
)

# グラフの表示
fig = go.Figure(data=plot, layout=layout)
fig.show()

# グラフの保存
prefix = 'plotly-buttons-args2'
save_name = f"{prefix}_second_buttons"
pio.orca.config.executable = '/Applications/orca.app/Contents/MacOS/orca'
pio.write_html(fig, f"{save_name}.html")
pio.write_image(fig, f"{save_name}.png")
args3はなくてエラーになる
ValueError: Invalid property specified for object of type plotly.graph_objs.layout.updatemenu.Button: 'args3'

Did you mean "args"?

    Valid properties:
        args
            Sets the arguments values to be passed to the Plotly
            method set in `method` on click.
        args2
            Sets a 2nd set of `args`, these arguments values are
            passed to the Plotly method set in `method` when
            clicking this button while in the active state. Use
            this to create toggle buttons.
        execute
            When true, the API method is executed. When false, all
            other behaviors are the same and command execution is
            skipped. This may be useful when hooking into, for
            example, the `plotly_buttonclicked` method and
            executing the API command manually without losing the
            benefit of the updatemenu automatically binding to the
            state of the plot through the specification of `method`
            and `args`.
        label
            Sets the text label to appear on the button.
        method
            Sets the Plotly method to be called on click. If the
            `skip` method is used, the API updatemenu will function
            as normal but will perform no API calls and will not
            bind automatically to state updates. This may be used
            to create a component interface and attach to
            updatemenu events manually via JavaScript.
        name
            When used in a template, named items are created in the
            output figure in addition to any items the figure
            already has in this array. You can modify these items
            in the output figure by making your own item with
            `templateitemname` matching this `name` alongside your
            modifications (including `visible: false` or `enabled:
            false` to hide it). Has no effect outside of a
            template.
        templateitemname
            Used to refer to a named item in this array in the
            template. Named items from the template will be created
            even without a matching item in the input figure, but
            you can modify one by making an item with
            `templateitemname` matching its `name`, alongside your
            modifications (including `visible: false` or `enabled:
            false` to hide it). If there is no template or no
            matching item, this item will be hidden unless you
            explicitly show it with `visible: true`.
        visible
            Determines whether or not this button is visible.

Did you mean "args"?

Bad property path:
args3
^^^^^
argsで1回目のボタン操作、args2で2回目のボタン操作ができるが、args3は存在せずエラーになる。
なので、3回目のボタン押下を実現することは基本的にはできないと考えるのが良いだろう(条件分岐で無理やりやることはできるかもしれない)。
その他の引数については公式ドキュメント参照。
マーカーと線をボタンで切り替え
ということで最後にボタン機能を応用してマーカーと線を変更する処理を作成した。このグラフのボタンでは以下の機能がある。
symbol size- 1回目:マーカーサイズが30に
- 2回目:マーカーサイズが6に
line dash- 1回目:線が破線に
- 2回目:線が実線に
line width & symbol- 1回目:線の太さが0.5、マーカーが大きさ15の
starに - 2回目:線の太さが2、マーカーが大きさ10の
squareに
- 1回目:線の太さが0.5、マーカーが大きさ15の
このグラフを作成するためのコード全文はこの章の最後に記載するとして、以下で各ボタンの解説をする。
symbol sizeボタン
マーカーのサイズは
marker=dict(size=30)の形式で記述できる。ただし、Plotlyでは.を使って途中のdictを省略することが可能。ここではmarker.sizeでマーカーのサイズを変更している。デフォルトのマーカーサイズは6なので、
updatemenusのactive=-1に設定する場合はargsに変更後の処理を記述する必要がある。もちろんactive=0ならargs2に変更後の処理を記述する。なお、ボタンの
method=’update’だとプロットとレイアウトの両方を変更できるので、ここではグラフタイトルにそれぞれのマーカーサイズを表示するようにした。# args2を適用しマーカーのシンボルのサイズを変更するボタンを作成 button_size = dict( label='symbol size', # ボタンのラベル method='update', # ボタンの適用範囲はデータプロットとレイアウト # aegsを1回押した時のボタンの挙動 args=[ {'marker.size': 30}, # プロットのマーカーのサイズを変更 dict(title='symbol size: 30'), # グラフタイトル ], # aegs2がもう一回押した時のボタンの挙動 args2=[ {'marker.size': 6}, # プロットのマーカーのサイズをデフォルトに dict(title='symbol size: 6'), # グラフタイトル ] )line dashボタン
線の種類を変更するためのボタンも同じように作成できる。線の種類(
dash)はline.dashで変更可能、変更できる線の種類は以下の6種類。'solid': 実線'dot': 点線'dash': 破線'longdash': 長い破線'dashdot': 一点鎖線'longdashdot': 長い破線の一点鎖線'5px,10px,2px,2px': 5, 10, 2, 2 pixごとの破線
詳しくは公式ドキュメント参照。
# args2を適用し線の種類を変更するボタンを作成 button_dash = dict( label='line dash', # ボタンのラベル method='update', # ボタンの適用範囲はデータプロットとレイアウト # aegsを1回押した時のボタンの挙動 args=[ {'line.dash': 'dash'}, # プロット線の種類を破線に dict(title='line dash: dash'), # グラフタイトル ], # aegs2がもう一回押した時のボタンの挙動 args2=[ {'line.dash': 'solid'}, # プロット線の種類を実線に dict(title='line dash: solid'), # グラフタイトル ] )line width & symbolボタン
最後に線の太さとマーカーの種類とサイズを変更するボタンを作成。設定内容は以下。
- 1回目
- 線の太さ
line.width=0.5 - マーカーの種類
marker.symbol=’star’ - マーカーの大きさ
'marker.size'=15
- 線の太さ
- 2回目
- 線の太さ
line.width=2 - マーカーの種類
marker.symbol=’square’ - マーカーの大きさ
'marker.size'=10
- 線の太さ
それぞれの処理は
args,args2に辞書形式で並べて記述すればいい。# args2を適用し線の太さ・マーカーの種類とサイズを変更するボタンを作成 button_width_symbol = dict( label='line width & symbol', # ボタンのラベル method='update', # ボタンの適用範囲はデータプロットとレイアウト # aegsを1回押した時のボタンの挙動 args=[ { 'line.width': 0.5, # 線の太さ 'marker.symbol': 'star', # マーカーの種類 'marker.size': 15 # マーカーのサイズ }, # グラフタイトルと横軸ラベル dict(title='line width: 0.5', xaxis=dict(title='X (1st button)')), ], # aegs2がもう一回押した時のボタンの挙動 args2=[ { 'line.width': 2, # 線の太さ 'marker.symbol': 'square', # マーカーの種類 'marker.size': 10 # マーカーのサイズ }, # グラフタイトルと縦軸ラベル dict(title='line width: 2', yaxis=dict(title='Y (2nd button)')), ] )- 1回目
あとはそれぞれのボタンをまとめて変数buttonsに配列として格納してupdatemenusで参照してグラフを作成すればいいだけ。
import plotly.graph_objects as go
import plotly.io as pio
# シンボルサイズや線の種類・大きさを変更したボタンを作成
x = (0, 1, 2, 3, 4)
y1 = (0, 1, 4, 3, 2)
y2 = (1, 3, 2, 4, 0)
# 配列の要素にプロット内容を格納
plot = [
go.Scatter(x=x, y=y1, name='y1'),
go.Scatter(x=x, y=y2, name='y2'),
]
# args2を適用しマーカーのシンボルのサイズを変更するボタンを作成
button_size = dict(
    label='symbol size',  # ボタンのラベル
    method='update',  # ボタンの適用範囲はデータプロットとレイアウト
    # aegsを1回押した時のボタンの挙動
    args=[
        {'marker.size': 30},  # プロットのマーカーのサイズを変更
        dict(title='symbol size: 30'),  # グラフタイトル
    ],
    # aegs2がもう一回押した時のボタンの挙動
    args2=[
        {'marker.size': 6},  # プロットのマーカーのサイズをデフォルトに
        dict(title='symbol size: 6'),  # グラフタイトル
    ]
)
# args2を適用し線の種類を変更するボタンを作成
button_dash = dict(
    label='line dash',  # ボタンのラベル
    method='update',  # ボタンの適用範囲はデータプロットとレイアウト
    # aegsを1回押した時のボタンの挙動
    args=[
        {'line.dash': 'dash'},  # プロット線の種類を破線に
        dict(title='line dash: dash'),  # グラフタイトル
    ],
    # aegs2がもう一回押した時のボタンの挙動
    args2=[
        {'line.dash': 'solid'},  # プロット線の種類を実線に
        dict(title='line dash: solid'),  # グラフタイトル
    ]
)
# args2を適用し線の太さ・マーカーの種類とサイズを変更するボタンを作成
button_width_symbol = dict(
    label='line width & symbol',  # ボタンのラベル
    method='update',  # ボタンの適用範囲はデータプロットとレイアウト
    # aegsを1回押した時のボタンの挙動
    args=[
        {
            'line.width': 0.5,  # 線の太さ
            'marker.symbol': 'star',  # マーカーの種類
            'marker.size': 15  # マーカーのサイズ
        },
        # グラフタイトルと横軸ラベル
        dict(title='line width: 0.5', xaxis=dict(title='X (1st button)')),
    ],
    # aegs2がもう一回押した時のボタンの挙動
    args2=[
        {
            'line.width': 2,  # 線の太さ
            'marker.symbol': 'square',  # マーカーの種類
            'marker.size': 10  # マーカーのサイズ
        },
        # グラフタイトルと縦軸ラベル
        dict(title='line width: 2', yaxis=dict(title='Y (2nd button)')),
    ]
)
# ボタンをlistにまとめる
buttons = [button_size, button_dash, button_width_symbol]
# レイアウトに設置するためのupdatemenus作成
updatemenus = [
dict(
# active=0にしていると、args2のボタンが1回目の処理扱いになる
active=-1, # 初期グラフで見た目上、押されるボタン
type='buttons', # ボタンのタイプはボタンに
direction='right', # ボタンは右向きに配置
x=0.5, y=1.01, # ボタンの位置
xanchor='center', yanchor='bottom', # ボタンの位置の基準
buttons=buttons, # ここに設定したボタン情報を入れる
)
]
# レイアウトの作成
layout = go.Layout(
font_size=20, # グラフ全体のフォントサイズ
hoverlabel_font_size=20, # ホバーのフォントサイズ
updatemenus=updatemenus, # ボタンを設置
)
# グラフの表示
fig = go.Figure(data=plot, layout=layout)
fig.show()
# グラフの保存
prefix = 'plotly-buttons-args2'
save_name = f"{prefix}_second_buttons_ex"
pio.orca.config.executable = '/Applications/orca.app/Contents/MacOS/orca'
pio.write_html(fig, f"{save_name}.html")
pio.write_image(fig, f"{save_name}.png")
ボタンで設定した内容だけ処理される
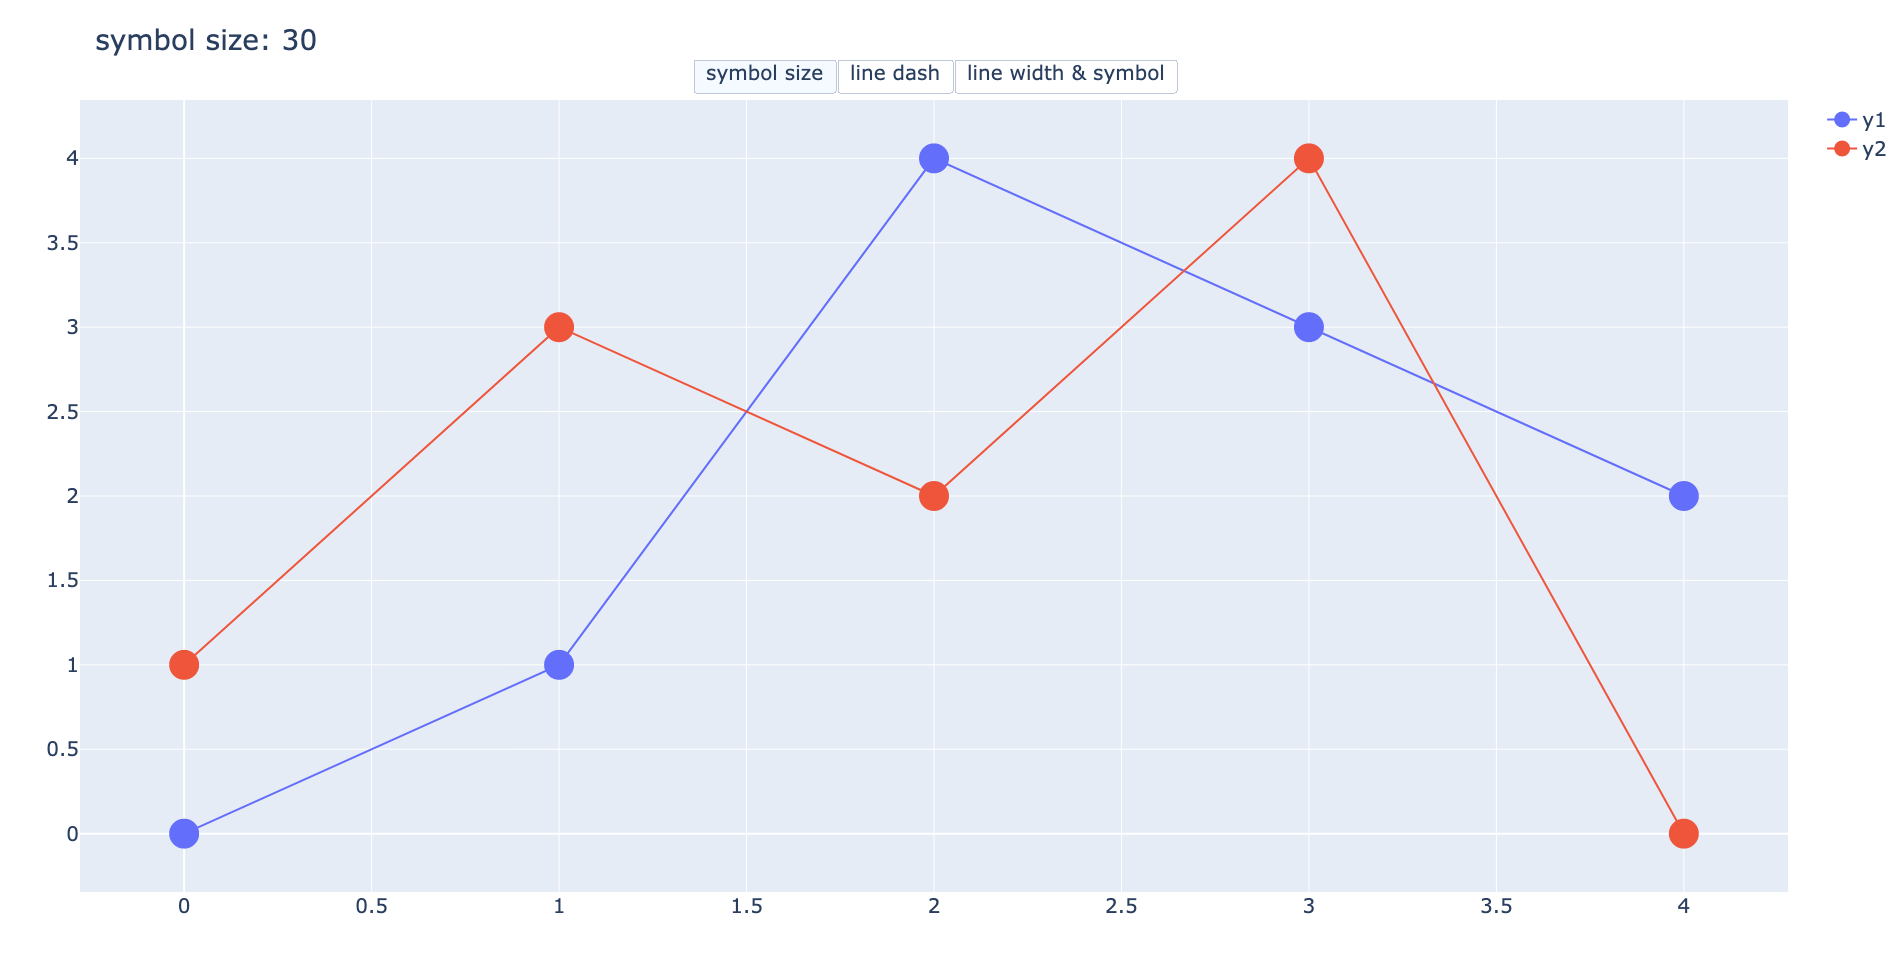
グラフを作成して最初にsymbol sizeボタンを押す。そうするとargsの「マーカーサイズを30にする」の処理でマーカーサイズが30になる。この状態が上のグラフ。
続いてline dashを押すと線の種類が初期状態の実線からline dashのargsに従ってdash:破線に変わる。これが下のグラフの状態。
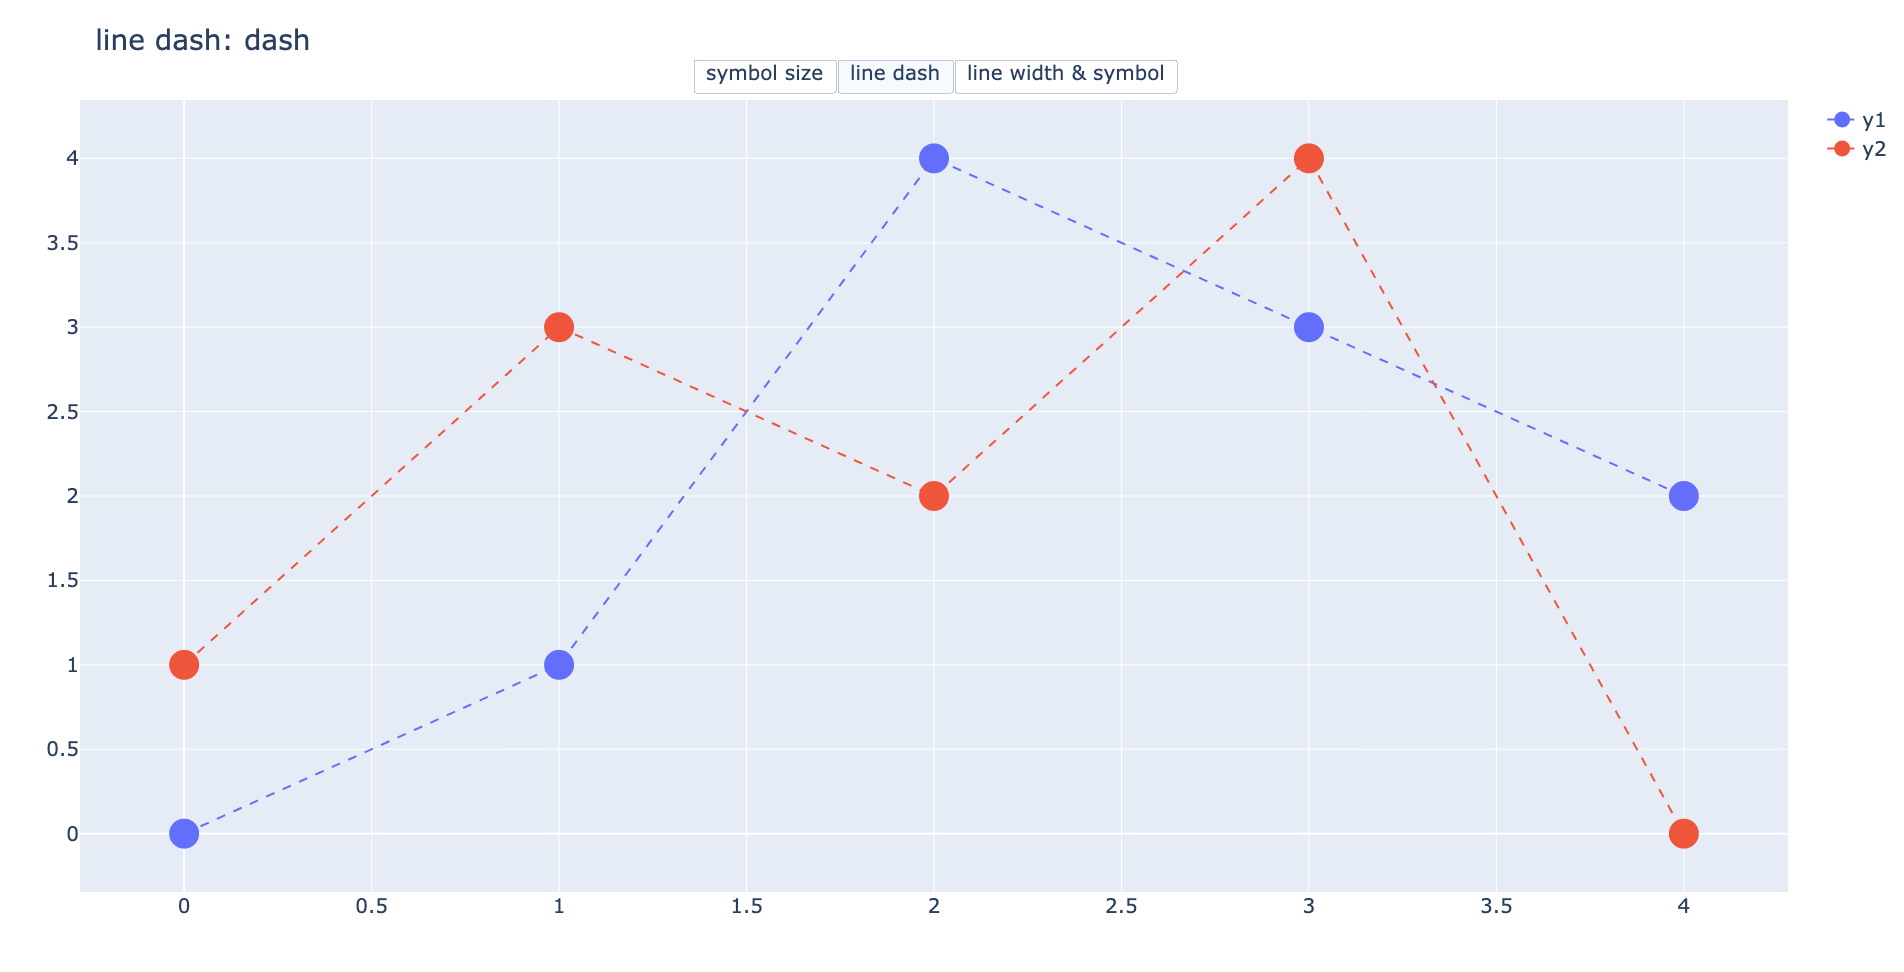
この時、マーカーサイズはsymbol sizeで変更した30のサイズのまま。そりゃline dashで変更したのは線の種類だけだから当たり前だが、案外落とし穴になるので注意。
さらに、この状態でline width & symbolボタンを押すと線の太さとマーカーの種類・サイズは変更されるが線の種類はdashのまま。これが下のグラフの状態。
args, args2で指定した処理だけが実行され、指定していない部分については何も変更がないことに注意。
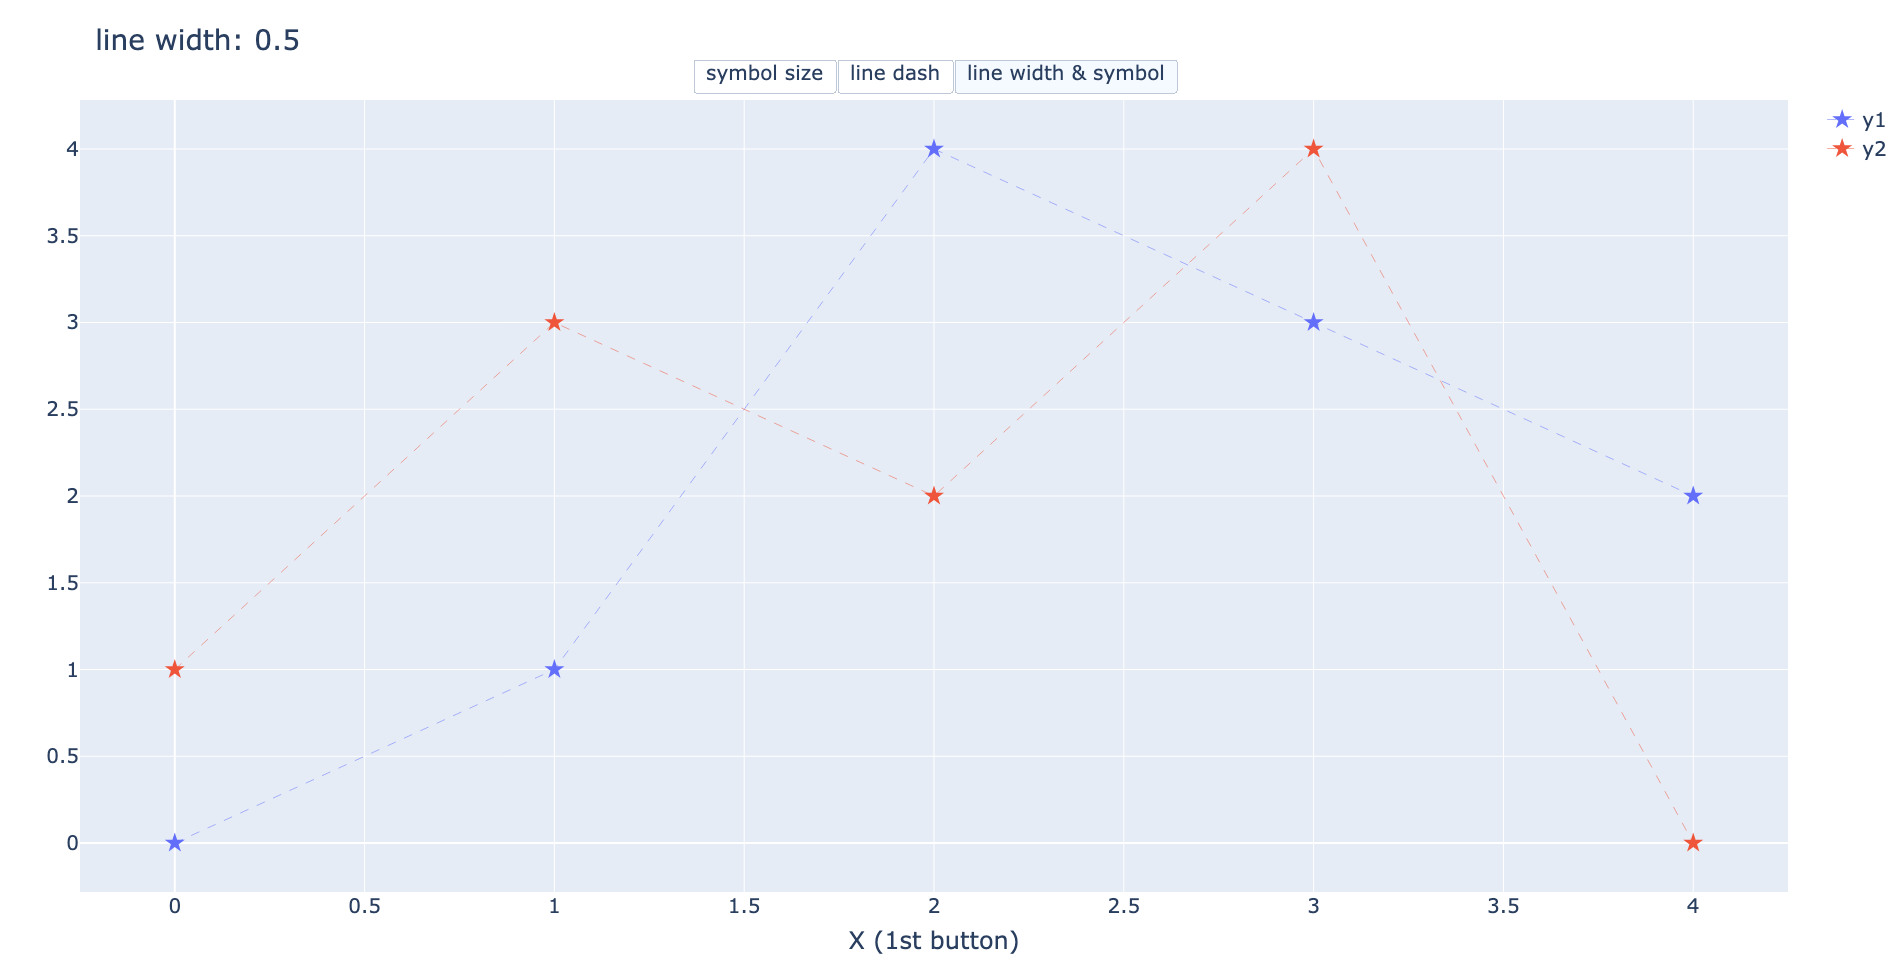
また、line width & symbolボタンではグラフの横軸と縦軸にタイトル(軸ラベル)をつけるように設定しているが、symbol size・line dashのどちらのボタンにも軸ラベルを変更する処理がない。
すなわち一度line width & symbolボタンを押して軸ラベルを追加してしまうとこのグラフを再度作成もしくはリロードしない限り軸ラベルが消えることはない。
いまいち要領が掴めていない人は色々とボタンを押して試してほしい。傾向が掴めるはず。
2回目のボタンでさらに自由度が増す
ということで今回はPlotlyのupdatemenusのボタンに2回目のボタン押下機能を追加する方法を解説した。方法はシンプルにargs2を設定するだけなので簡単だっただろう。
今回の内容は以下のPlotlyでボタンを追加する方法の派生系なので、まだ読んでいない人は併せて読んでいただくことをおすすめする。
-

-
【Plotly&ボタン】updatemenusとbuttonsでボタン機能を追加
Plotlyはプロットしたデータを動かすことができるのが大き ...
続きを見る
ただでさえ自由度の高いPlotlyにボタン押下の機能を追加することでさらに使い勝手が良いグラフを作成することができるだろう。
今回の記事を参考により高度なグラフを作成いただきたい。
関連記事
-

-
【Plotly&ボタン】updatemenusとbuttonsでボタン機能を追加
Plotlyはプロットしたデータを動かすことができるのが大き ...
続きを見る
-
-
【Plotlyで散布図】go.Scatterのグラフの描き方まとめ
これからPloltyで動くグラフを作りたい、もっとグラフをキ ...
続きを見る
-
-
【Plotly&sliders】スライダーを追加しデータを切り変える
本記事ではPlotlyでデータの流れを簡単に理解できる機能の ...
続きを見る
-

-
【Pythonを独学】社会人が1人で学習できるのか。結論、学べるが...
今回は社会人がプログラミング言語「Python」を独学で学習 ...
続きを見る
